You're viewing 3 free preview questions for Biology HL — subscribe to unlock 96 more, plus the Full Question Bank, Mock Papers & Worksheets.Upgrade
Muscle and Motility · Paper 2 — Free Biology HL Practice Questions
1MasterySAQ-SMuscle structure and contraction mechanisms6 marksPaper 2~9 min

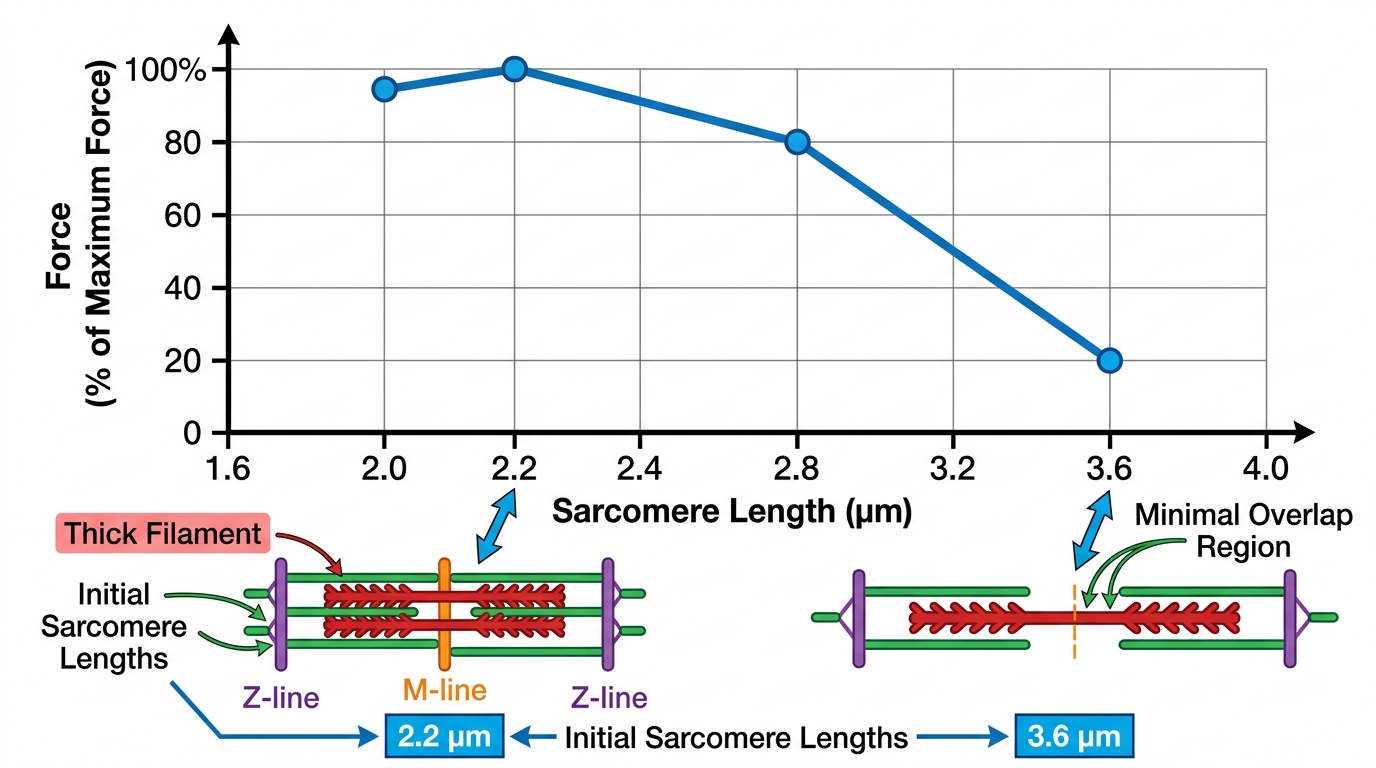
A researcher investigates the relationship between sarcomere length and force generated by a single skeletal muscle fibre. The fibre is stimulated to contract maximally at various initial sarcomere lengths.
Sarcomere length / — Force as percentage of maximum
—
—
—
—
(a)
State the sarcomere length at which the greatest number of cross-bridges can form. [1 mark]
(b)
Deduce why force generation at a sarcomere length of is less than at , despite greater actin–myosin overlap. [2 marks]
(c)
Explain, using sliding filament theory, why force generation decreases progressively as sarcomere length increases beyond , and calculate the percentage decrease in force between and . [3 marks]

Solutions
2MasterySAQ-SMuscle structure and contraction mechanisms5 marksPaper 2~8 min
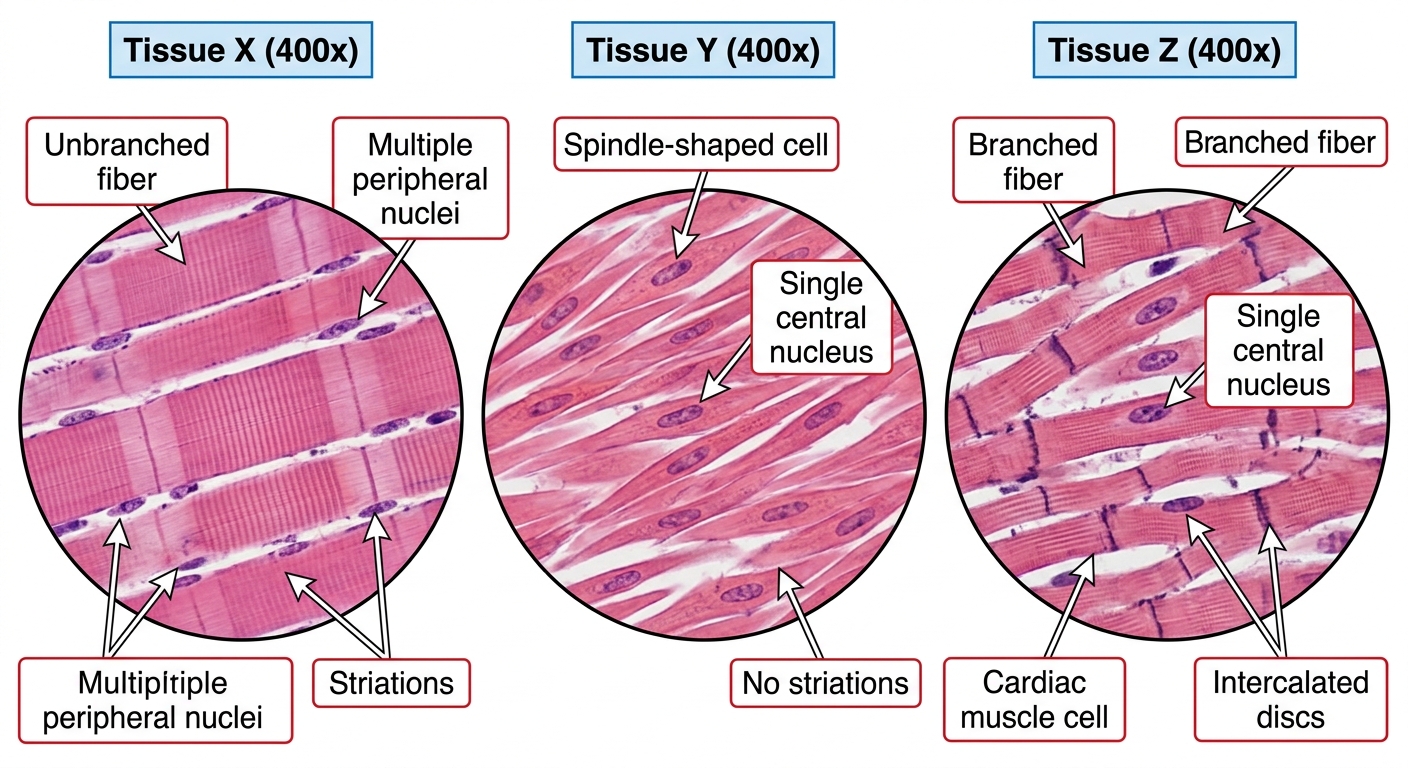
A student examines stained sections of three different types of muscle tissue under a light microscope. Tissue X shows long, unbranched fibres with multiple peripheral nuclei and visible striations. Tissue Y shows short, spindle-shaped cells with a single central nucleus and no striations. Tissue Z shows branched fibres with intercalated discs and a single central nucleus.
(a)
State two structural features visible under a light microscope that distinguish Tissue X from Tissue Y. [2 marks]
(b)
Identify which tissue (X, Y, or Z) is most likely found in the wall of a blood vessel. Justify your answer. [2 marks]
(c)
The student measures the image width of a single Tissue Z cell as on a micrograph taken at a total magnification of . Calculate the actual width of the cell in micrometres (). [1 mark]
Solutions
3ChallengeLAQMuscle structure and contraction mechanisms10 marksPaper 2~15 min
Data
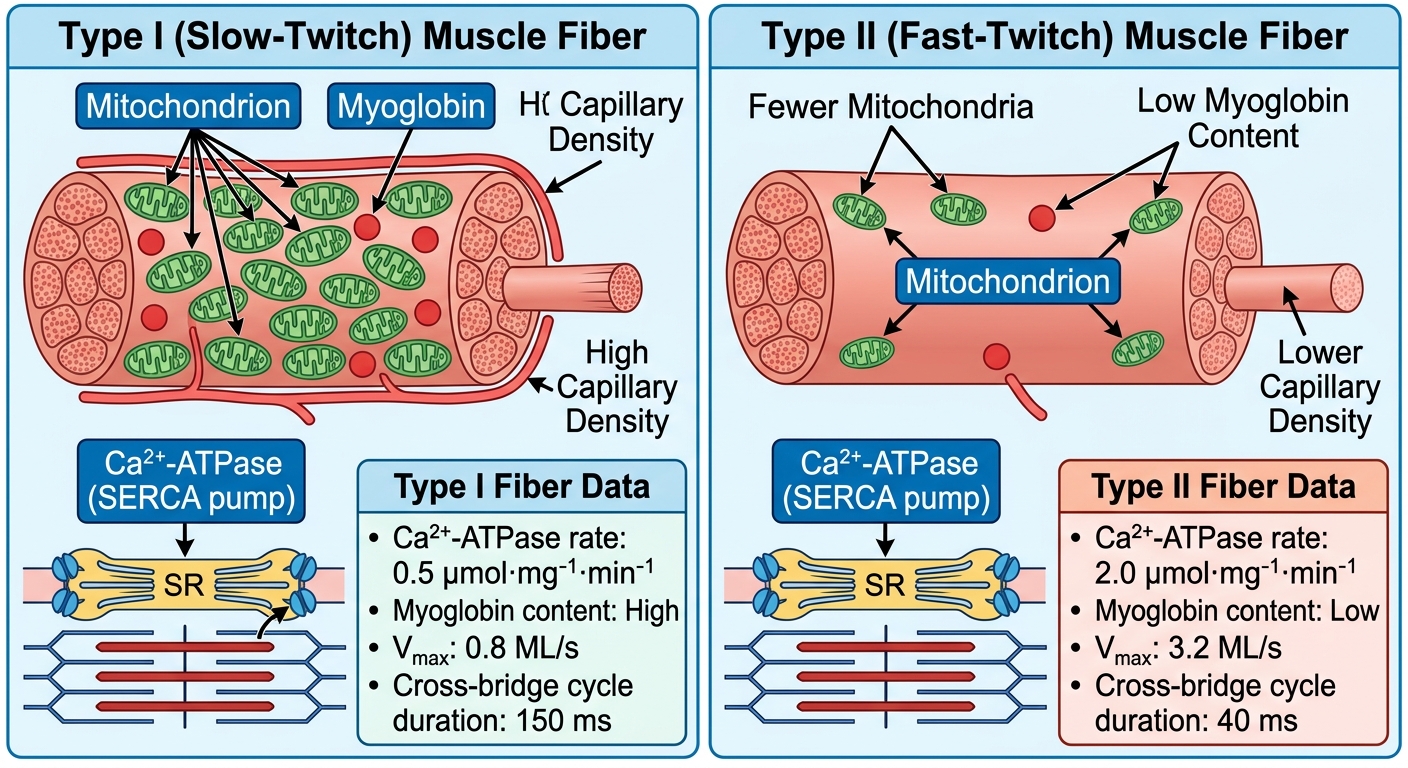
- Type I fibres: high myoglobin content, numerous mitochondria, high capillary density, Ca-ATPase rate , low myosin ATPase activity
- Type II fibres: low myoglobin content, fewer mitochondria, lower capillary density, Ca-ATPase rate , high myosin ATPase activity
- Maximum shortening velocity (): Type I ; Type II
- Cross-bridge cycle duration: Type I ; Type II
Skeletal muscle contraction is explained by the sliding filament theory, which describes the interaction between actin and myosin filaments. However, this theory does not fully account for the differences in contractile properties observed between slow-twitch (Type I) and fast-twitch (Type II) muscle fibres.
(a)
Explain how the difference in Ca-ATPase rate between Type I and Type II fibres contributes to the difference in their cross-bridge cycle duration. [4 marks]
(b)
Calculate the number of cross-bridge cycles per second for each fibre type. [2 marks]
(c)
A researcher proposes that the higher myoglobin content in Type I fibres could directly increase their force of contraction rather than affecting endurance. Using the data provided, evaluate this proposal. [4 marks]
Solutions
That's every free question here — 3 of 99.
+96 more questions, plus Mock Papers & Worksheets, are waiting in Premium.