You're viewing 3 free preview questions for Biology SL — subscribe to unlock 45 more, plus the Full Question Bank, Mock Papers & Worksheets.Upgrade
Sustainability and Change · Paper 2 — Free Biology SL Practice Questions
1MasterySAQ-SSustainable agricultural practices5 marksPaper 2~8 min

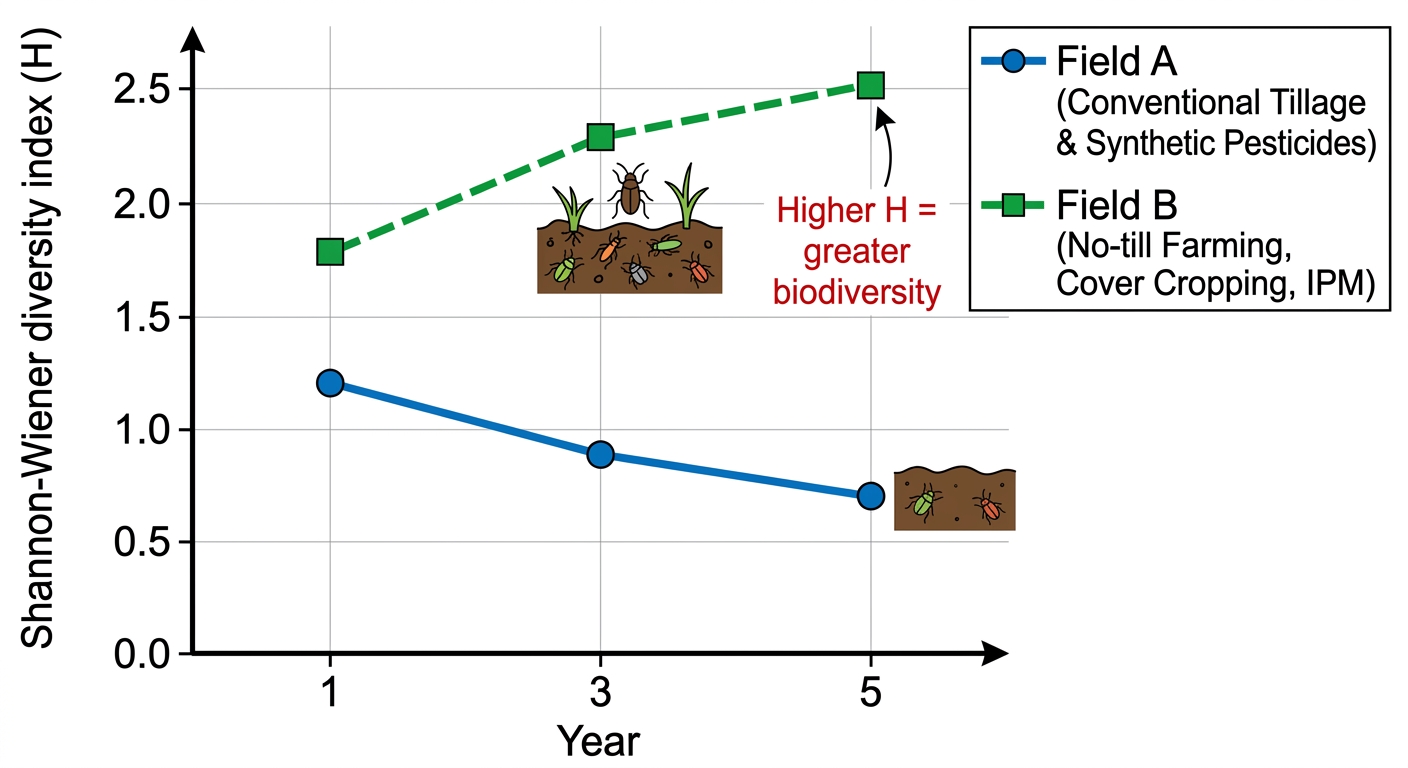
A researcher studies the effect of sustainable agricultural practices on soil biodiversity in a grassland ecosystem. She compares two adjacent fields over 5 years: Field A is managed with conventional tillage and synthetic pesticides; Field B uses no-till farming, cover cropping, and integrated pest management (IPM). The Shannon-Wiener diversity index () for soil invertebrates is measured each year. A higher value indicates greater biodiversity.
Year — Field A () — Field B ()
1 — —
3 — —
5 — —
(a)
State the trend in for Field A and for Field B over the 5-year period. [2 marks]
(b)
Calculate the percentage change in for Field A from Year 1 to Year 5. [1 mark]
(c)
Explain why increased in Field B but decreased in Field A, with reference to the agricultural practices used in each field. [2 marks]

Solutions
2ChallengeSAQ-LRenewable resources and ecological conservation7 marksPaper 2~11 min
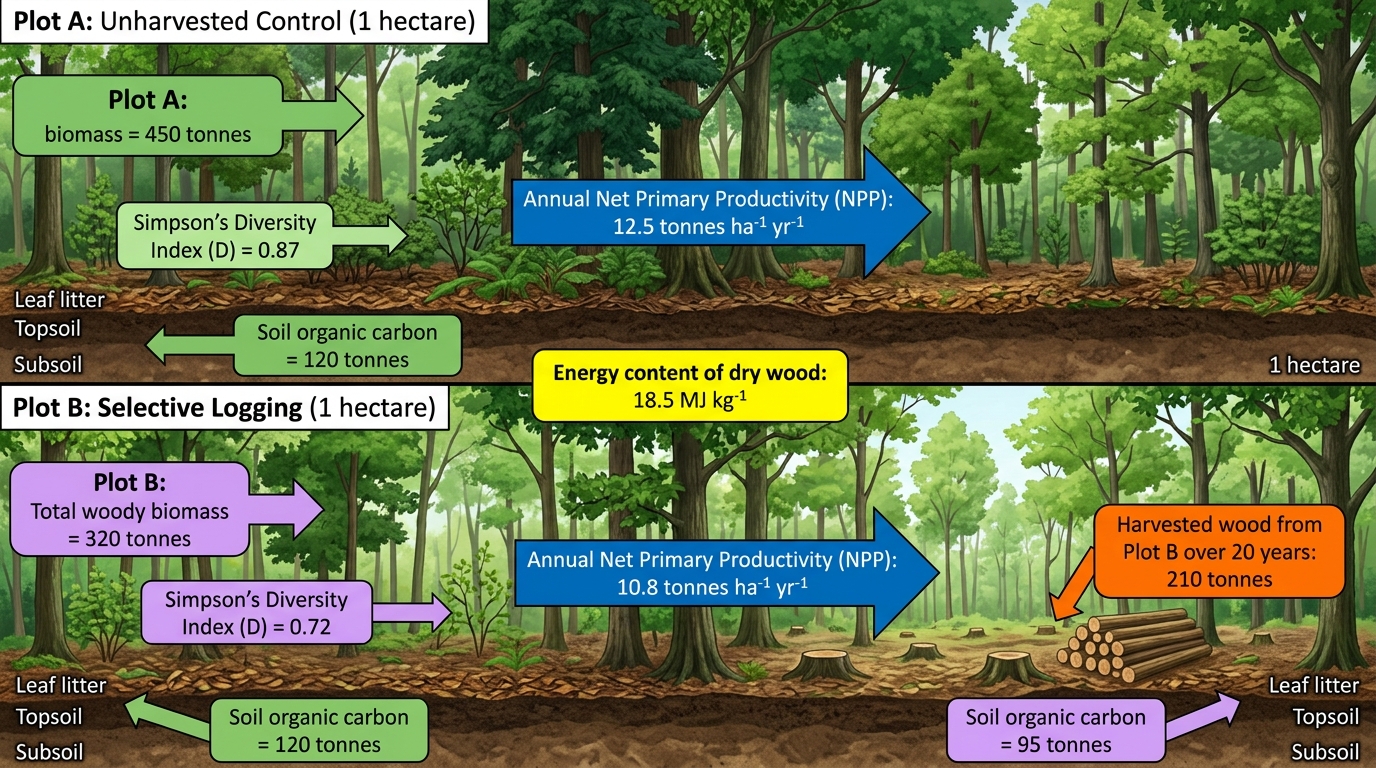
A field study was conducted in a temperate deciduous forest to evaluate the sustainability of harvesting wood for biofuel. Two plots were established: Plot A (unharvested control) and Plot B (selective logging of of tree biomass every 5 years). Data collected after 20 years are shown below.
Parameter — Plot A — Plot B
Total woody biomass — —
Simpson's Diversity Index () — —
Soil organic carbon — —
Annual NPP — —
- Harvested wood from Plot B over 20 years:
- Energy content of dry wood:
(a)
Determine the percentage change in Simpson's Diversity Index () from Plot A to Plot B, and state what this value indicates about species evenness in the logged plot. [2 marks]
(b)
Explain the mechanism by which selective logging could reduce soil organic carbon levels in Plot B compared to Plot A. [3 marks]
(c)
Evaluate whether the wood harvested from Plot B represents a renewable energy source over the 20-year period. Use calculations of energy yield and total NPP energy to support your answer. [2 marks]
Solutions
3ChallengeSAQ-LRenewable resources and ecological conservation7 marksPaper 2~11 min
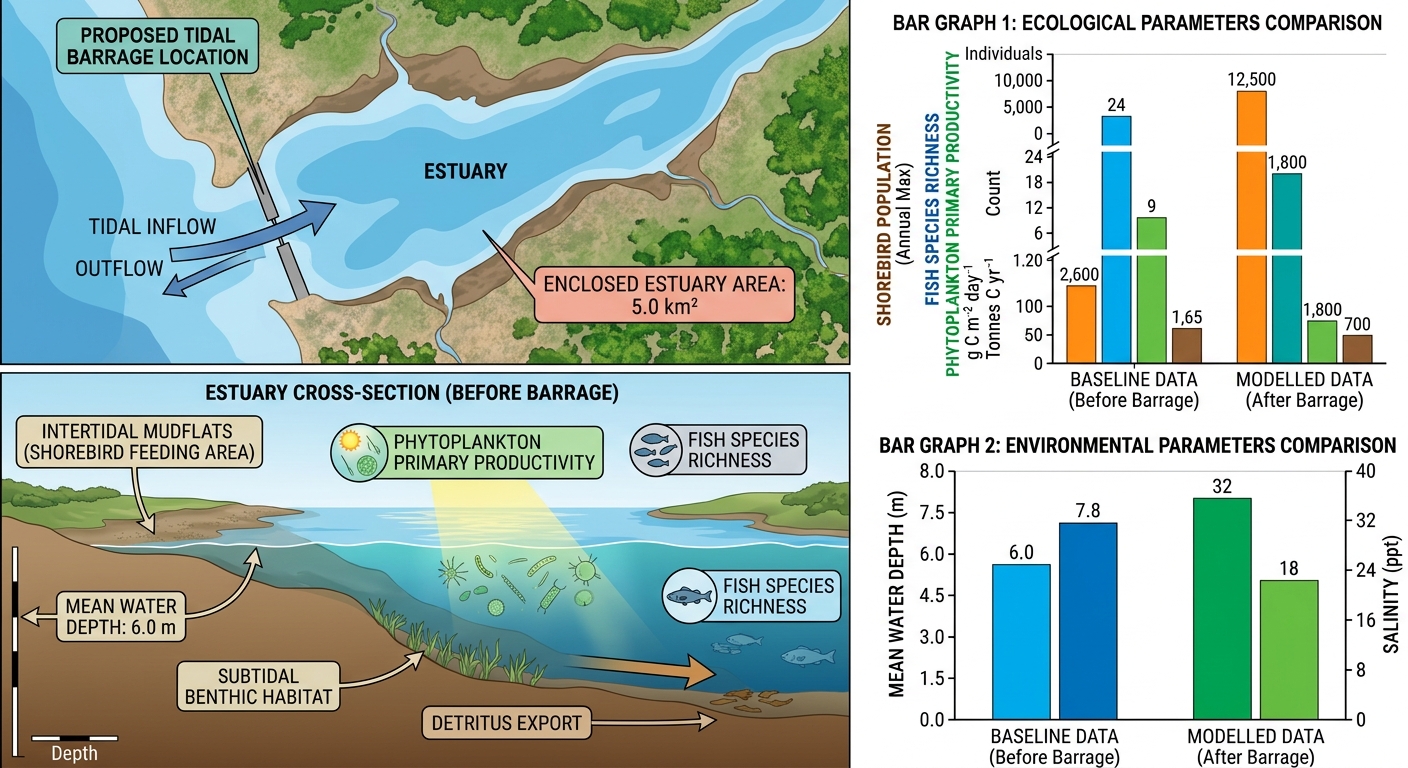
Data
Before construction:
- Mean tidal range:
- Salinity in estuary:
- Phytoplankton primary productivity:
- Fish species richness: species
- Shorebird population (annual maximum): individuals
- Detritus export to coastal waters:
After construction (modelled):
- Salinity behind barrage:
- Phytoplankton productivity:
- Fish species richness: species
- Shorebird population: individuals
- Detritus export:
A coastal community is evaluating the installation of a tidal barrage for renewable electricity generation. The barrage would enclose a estuary. Environmental impact assessments collected the following baseline
(a)
Calculate the percentage reduction in shorebird population following barrage construction. State one reason why fish species richness also declines. [2 marks]
(b)
Explain the mechanism by which reduced detritus export to coastal waters could affect offshore food webs. [2 marks]
(c)
Using the data provided, evaluate whether the tidal barrage represents a sustainable solution, considering both energy generation and ecological impact. [3 marks]
Solutions
That's every free question here — 3 of 48.
+45 more questions, plus Mock Papers & Worksheets, are waiting in Premium.