You're viewing 3 free preview questions for Economics HL — subscribe to unlock 97 more, plus the Full Question Bank, Mock Papers & Worksheets.Upgrade
Economics of Inequality and Poverty · Paper 1 — Free Economics HL Practice Questions
1FoundationSAQ-SCauses and consequences of income inequality8 marksPaper 1~12 min

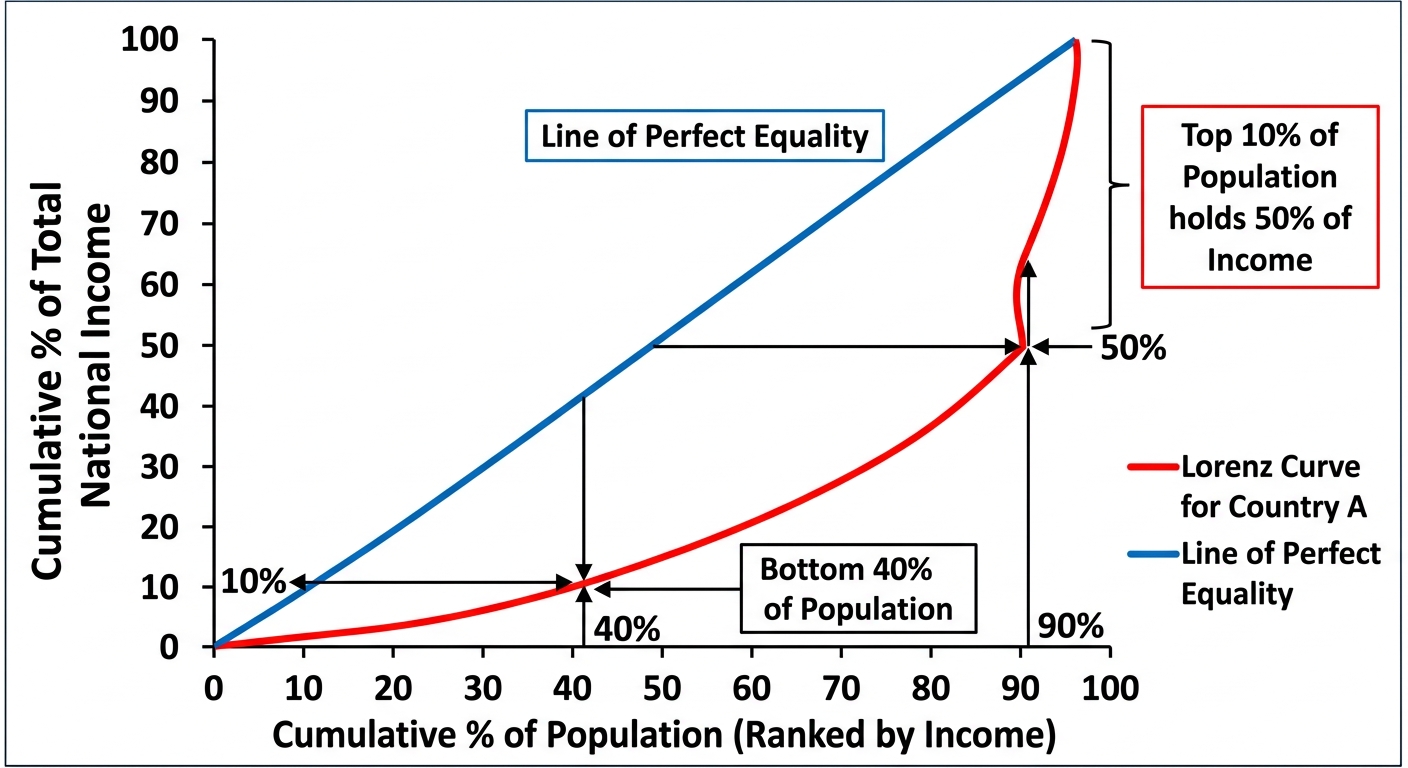
In Country A, the top of earners hold of total income, while the bottom hold only . A government report identifies inheritance of wealth as a major factor in this disparity.
(a)
Define "income inequality". [2 marks]
(b)
Explain one mechanism by which inheritance of wealth causes income inequality to persist across generations. [2 marks]
(c)
Using the data provided, evaluate the extent to which inheritance of wealth alone can explain income inequality in Country A. [4 marks]

Solutions
2FoundationSAQ-SCauses and consequences of income inequality8 marksPaper 1~12 min
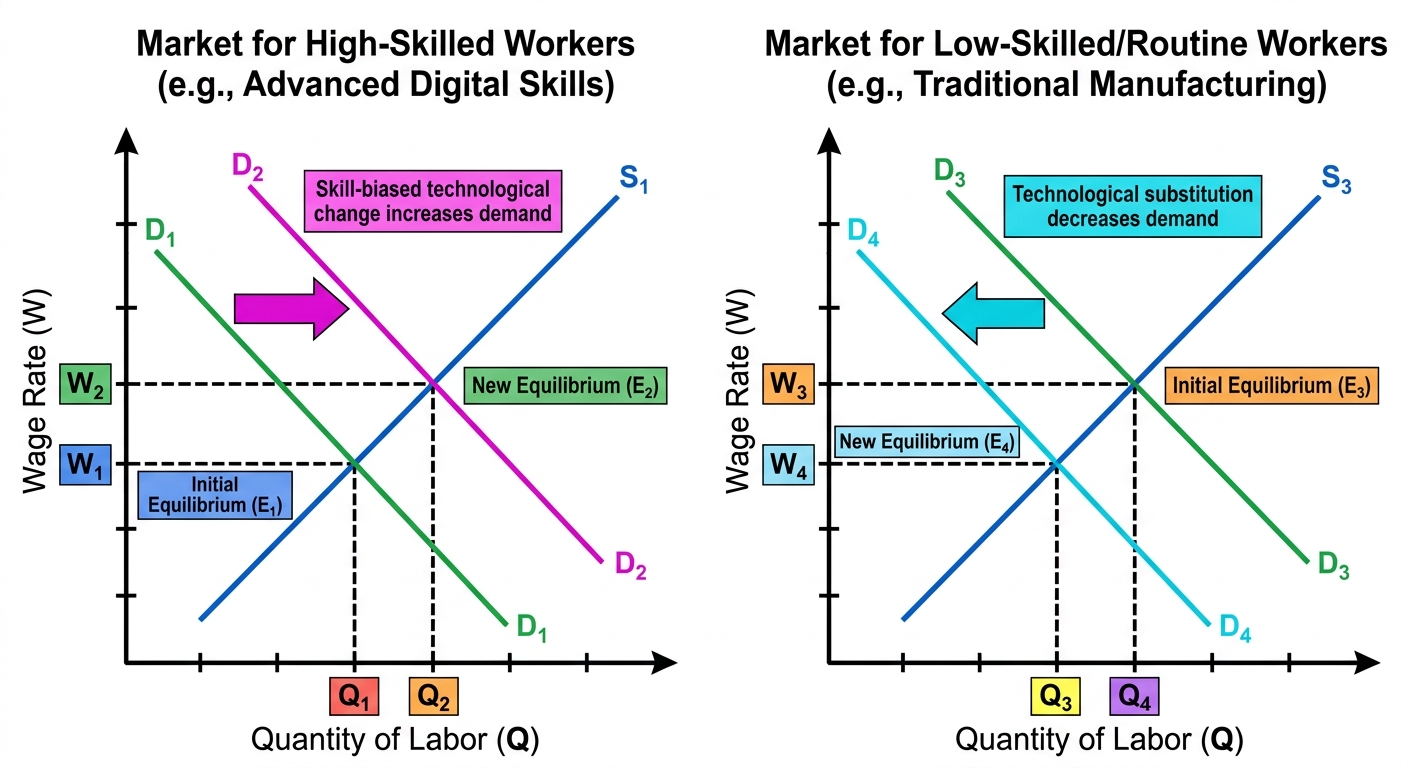
Country B has experienced rapid technological change, leading to high demand for workers with advanced digital skills. Meanwhile, workers in traditional manufacturing have seen their wages stagnate. The Gini coefficient for Country B rose from to over a decade of rapid automation.
(a)
Define "income inequality". [2 marks]
(b)
Explain how skill-biased technological change (SBTC) can cause income inequality in Country B. [2 marks]
(c)
Evaluate the extent to which SBTC is the most significant cause of the rise in Country B's Gini coefficient. [4 marks]
Solutions
3MasterySAQ-SCauses and consequences of income inequality7 marksPaper 1~11 min
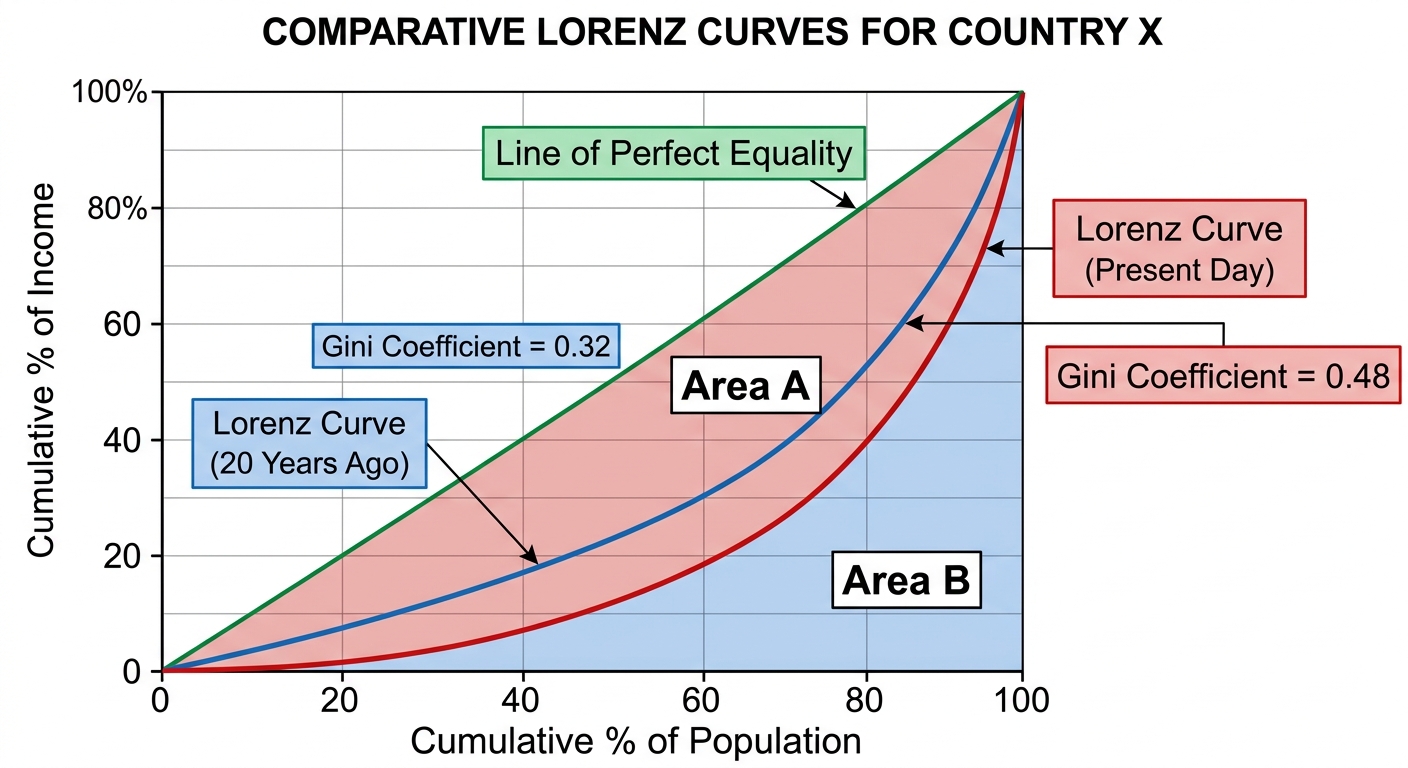
In Country X, the Gini coefficient has risen from to over the past 20 years. During this period, the government reduced the top marginal income tax rate from to , and trade liberalisation led to a rapid expansion of the financial services sector. Simultaneously, the minimum wage has remained unchanged in nominal terms, while the average years of schooling for the top of earners increased from to years, compared to an increase from to years for the bottom .
(a)
Define the term "Gini coefficient". [1 mark]
(b)
Explain how the change in the Gini coefficient from to would be represented on a Lorenz curve . [2 marks]
(c)
Analyse two causes of the rising income inequality in Country X, using the data provided. [4 marks]
Solutions
That's every free question here — 3 of 100.
+97 more questions, plus Mock Papers & Worksheets, are waiting in Premium.