You're viewing 3 free preview questions for Economics HL — subscribe to unlock 124 more, plus the Full Question Bank, Mock Papers & Worksheets.Upgrade
Macroeconomic Objectives · Paper 1 — Free Economics HL Practice Questions
1FoundationSAQ-SIncome distribution8 marksPaper 1~12 min

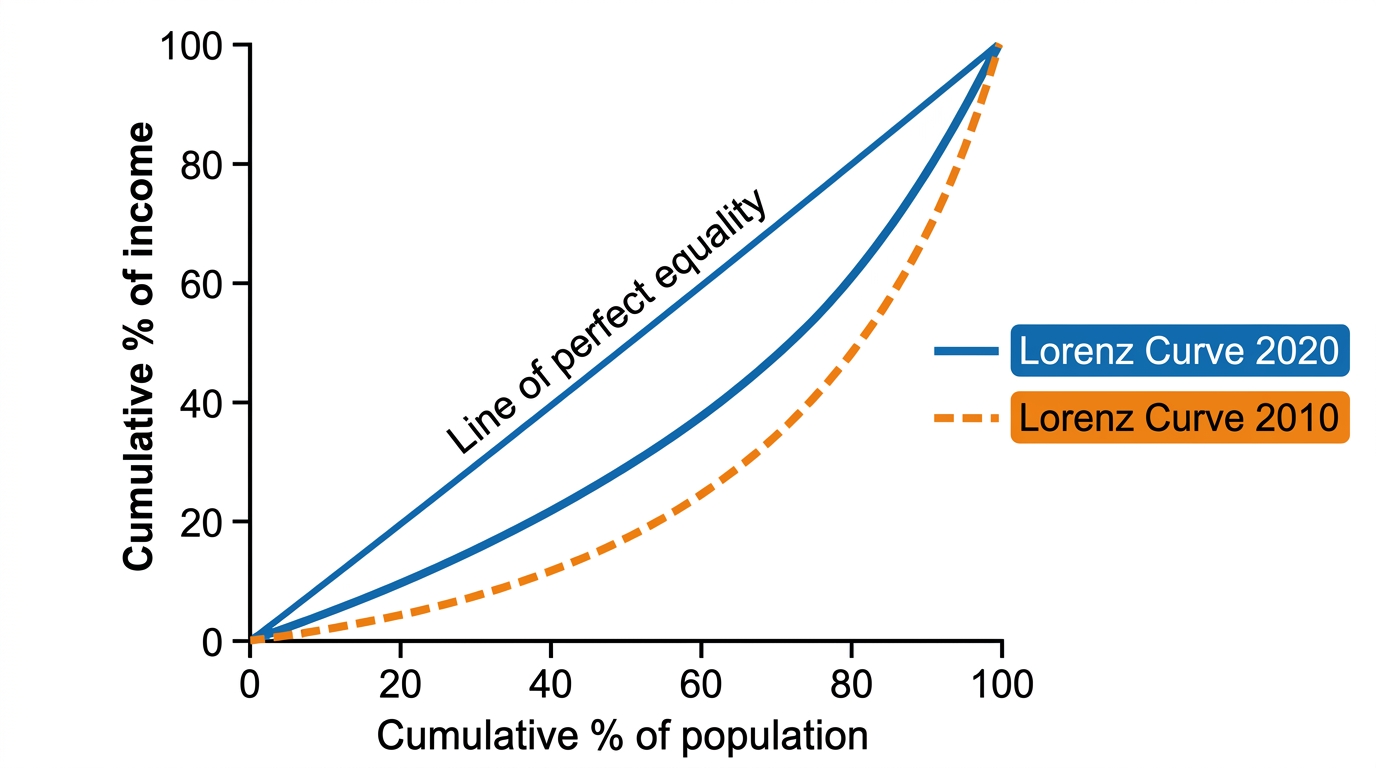
A government report states that the Gini coefficient for Country Z decreased from in 2010 to in 2020.
(a)
Define the term income distribution. [2 marks]
(b)
Using the data, explain what the change in the Gini coefficient suggests about income distribution in Country Z. [2 marks]
(c)
Evaluate the extent to which a falling Gini coefficient alone is sufficient evidence that living standards have improved for the poorest households in Country Z. [4 marks]

Solutions
2MasterySAQ-SEconomic growth4 marksPaper 1~6 min
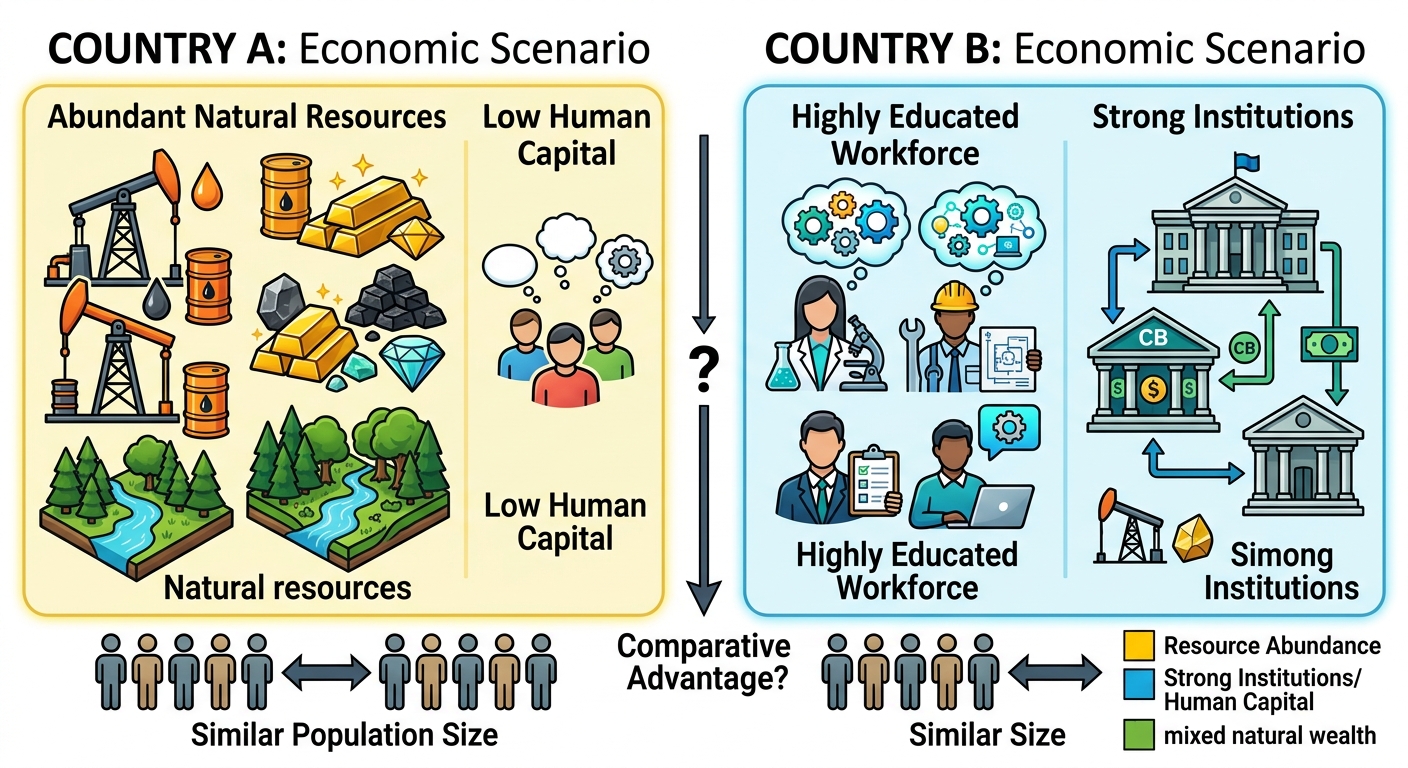
Country A has abundant natural resources (oil and minerals) but low levels of human capital. Country B has limited natural resources but a highly educated workforce and strong institutions. Both countries have similar population sizes.
(a)
Draw two fully labelled production possibilities curve (PPC) diagrams — one for Country A and one for Country B — showing each country's comparative advantage. Label the axes to reflect each country's dominant and non-dominant sector. [2 marks]
(b)
Explain, using the concept of factor endowments, why Country B is likely to experience more sustainable long-run economic growth than Country A. [2 marks]
Solutions
3MasterySAQ-SEconomic growth6 marksPaper 1~9 min
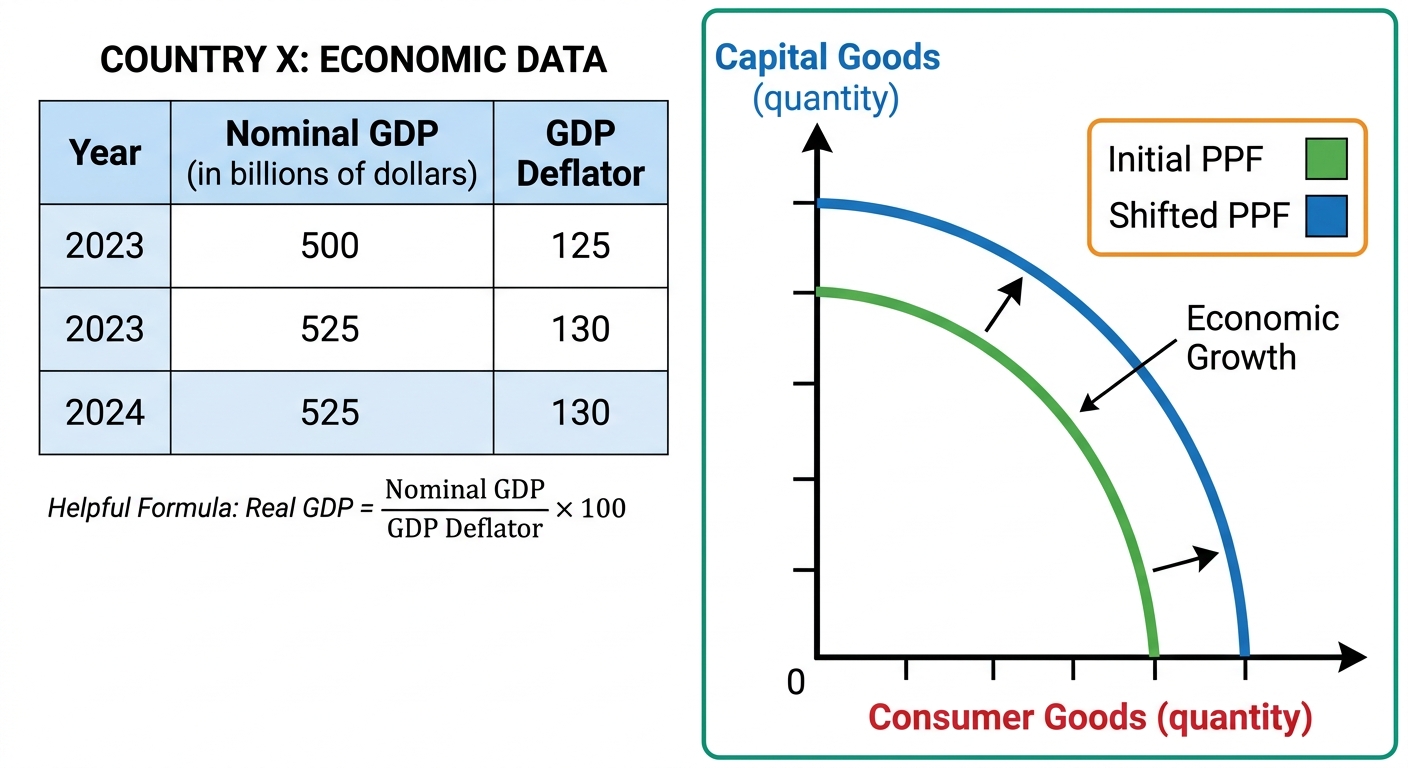
The nominal GDP of Country X was USD 500 billion in 2023 and USD 525 billion in 2024. The GDP deflator was in 2023 and in 2024.
(a)
Calculate the real GDP of Country X for 2023 and 2024. [2 marks]
(b)
Draw a correctly labelled production possibilities frontier (PPF) to show the effect of an increase in the quality of labour on the long-run productive capacity of Country X. [2 marks]
(c)
Explain why an increase in the quality of labour causes the change shown in your . [2 marks]
Solutions
That's every free question here — 3 of 127.
+124 more questions, plus Mock Papers & Worksheets, are waiting in Premium.