You're viewing 3 free preview questions for Economics SL — subscribe to unlock 154 more, plus the Full Question Bank, Mock Papers & Worksheets.Upgrade
Role of Government in Microeconomics · Paper 2 — Free Economics SL Practice Questions
1MasteryLAQEffects of government policies on markets6 marksPaper 2~9 min

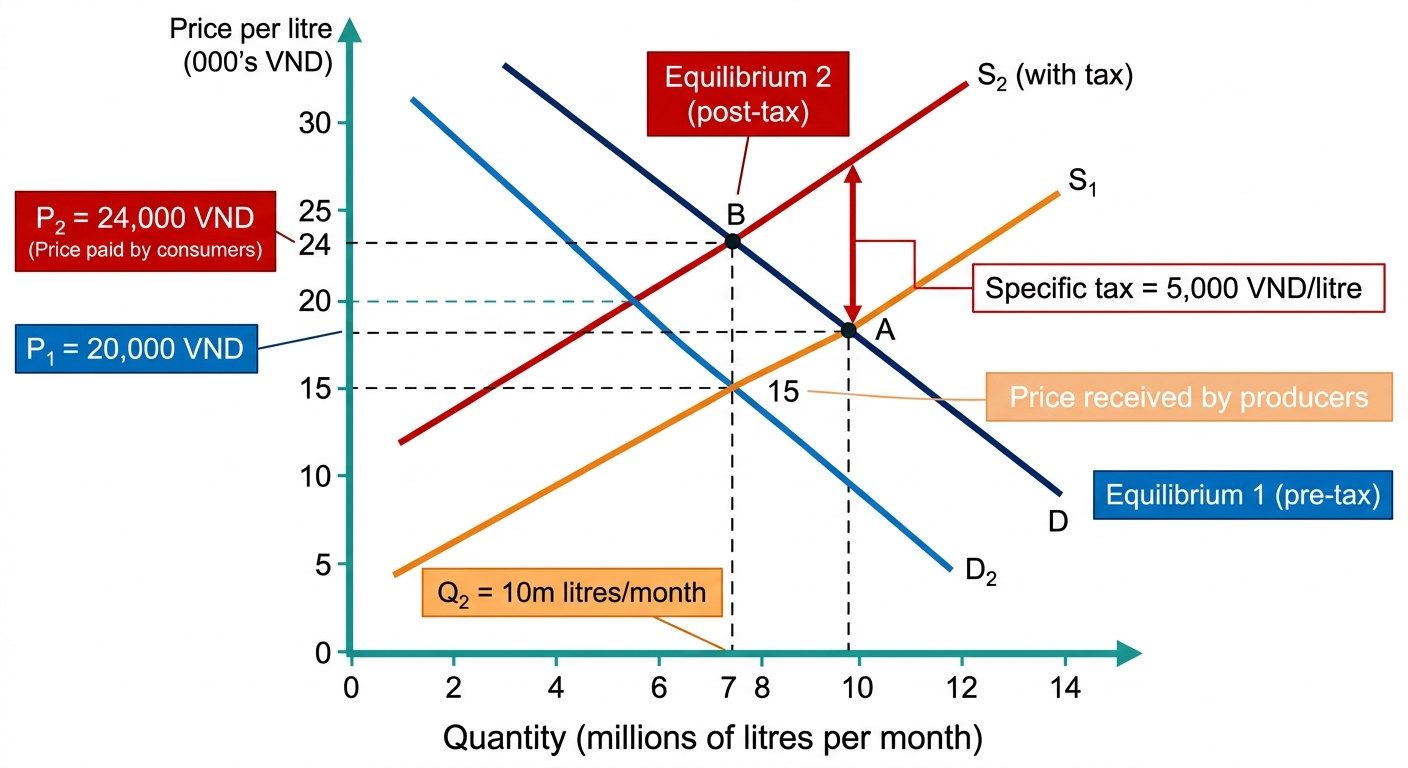
A government introduced a specific tax of per litre on sugary drinks. Prior to the tax, the market equilibrium price was per litre and equilibrium quantity was million litres per month. After the tax, consumers paid per litre, quantity traded fell to million litres per month, and the government collected billion per month in tax revenue.
(a)
(i) Using a fully labelled supply and demand , explain how the imposition of a specific tax on sugary drinks affects the market equilibrium. [4 marks]
(ii) On your from (a)(i), identify the areas representing consumer surplus, producer surplus, tax revenue, and deadweight loss after the tax is imposed. [2 marks]
(ii) On your from (a)(i), identify the areas representing consumer surplus, producer surplus, tax revenue, and deadweight loss after the tax is imposed. [2 marks]
(b)
(i) Using the data provided, analyse the impact of the tax on consumers, producers, and the government. [4 marks]
(ii) Evaluate the extent to which this tax achieves its intended goal of reducing the negative externalities associated with sugar consumption. [4 marks]
(ii) Evaluate the extent to which this tax achieves its intended goal of reducing the negative externalities associated with sugar consumption. [4 marks]

Solutions
2MasteryLAQEffects of government policies on markets10 marksPaper 2~15 min
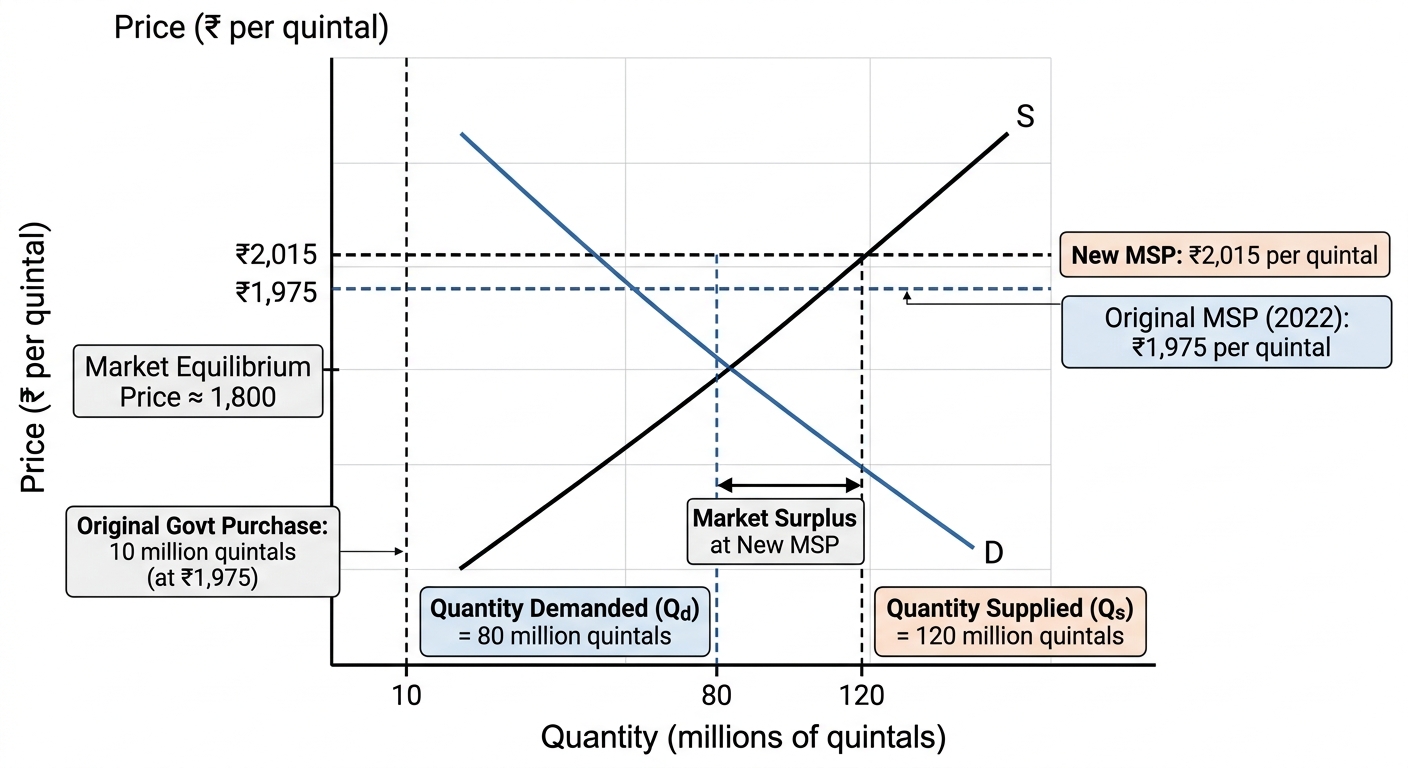
The government of India increased the minimum support price (MSP) for wheat from INR 1,800 per quintal (the market equilibrium price) to INR 2,015 per quintal. At INR 2,015, the quantity supplied by farmers is 120 million quintals and the quantity demanded by consumers is 80 million quintals. The government purchases all unsold surplus at the MSP.
(a)
(i) Draw a fully labelled supply and demand for the Indian wheat market showing:
- the free-market equilibrium price and quantity
- the MSP as a price floor
- the resulting surplus
- the areas of consumer surplus, producer surplus, government expenditure on the surplus, and deadweight loss [4]
(ii) Explain why the MSP creates a deadweight loss in the wheat market. [2 marks]
(ii) Explain why the MSP creates a deadweight loss in the wheat market. [2 marks]
(b)
Evaluate the effectiveness of the MSP policy in achieving its objectives of supporting farmer incomes and ensuring food security for consumers. [8 marks]
Solutions
3ChallengeLAQEffects of government policies on markets10 marksPaper 2~15 min
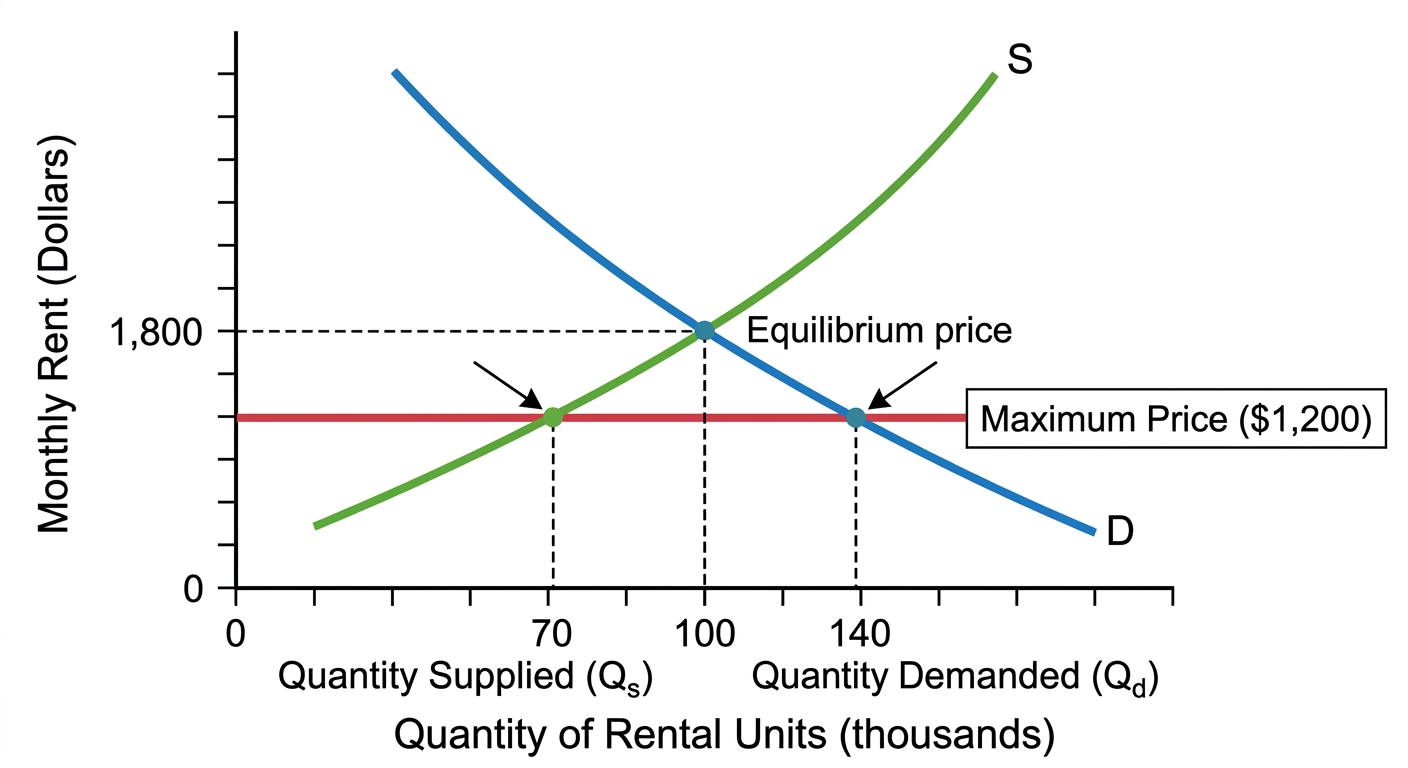
The government of Country X, a high-income economy, introduced a binding maximum price (price ceiling) on rental housing in its capital city in 2023. The policy aimed to improve housing affordability for low-income households.
The market for rental housing before the policy had an equilibrium monthly rent of USD 1800 and 100,000 units rented. The government set the maximum price at USD 1200 per month. At this price, quantity demanded is 140,000 units and quantity supplied is 70,000 units.
The price elasticity of demand (PED) for rental housing is estimated at in the short run and in the long run. The price elasticity of supply (PES) is estimated at in the short run and in the long run.
(a)
Using a fully labelled supply and demand , explain the immediate effects of this price ceiling on the rental housing market. [4 marks]
(b)
Using the elasticity data provided, evaluate the effectiveness of this price ceiling in improving housing affordability for low-income households in the short run and in the long run.
Formulae provided:
[6 marks]
Solutions
That's every free question here — 3 of 157.
+154 more questions, plus Mock Papers & Worksheets, are waiting in Premium.