You're viewing 3 free preview questions for Maths AA HL — subscribe to unlock 253 more, plus the Full Question Bank, Mock Papers & Worksheets.Upgrade
Descriptive Statistics · Paper 1 — Free Maths AA HL Practice Questions
1FoundationSAQ-SMeasures of central tendency (mean, median, mode)s5 marksPaper 1~8 min

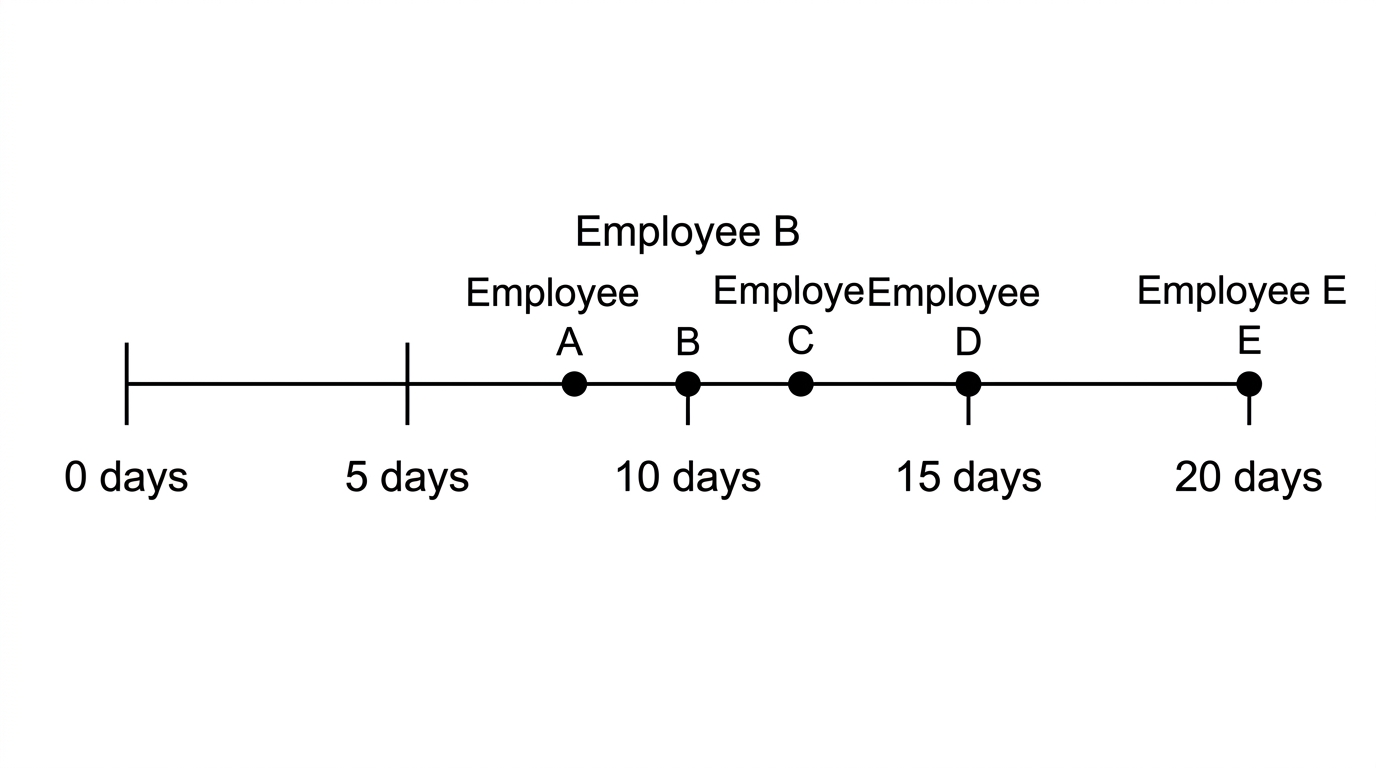
A small company records the number of days of sick leave taken by its five employees in one year. The data, in days, are:
(a)
State the median of the data. [1 mark]
(b)
Calculate the mean number of days of sick leave. [2 marks]
(c)
The value is considered a potential outlier. Evaluate whether removing this value would have a greater effect on the median or the mean, and hence determine which measure is more appropriate for summarising the original dataset. [2 marks]

Solutions
2MasterySAQ-SMeasures of central tendency (mean, median, mode)s7 marksPaper 1~11 min
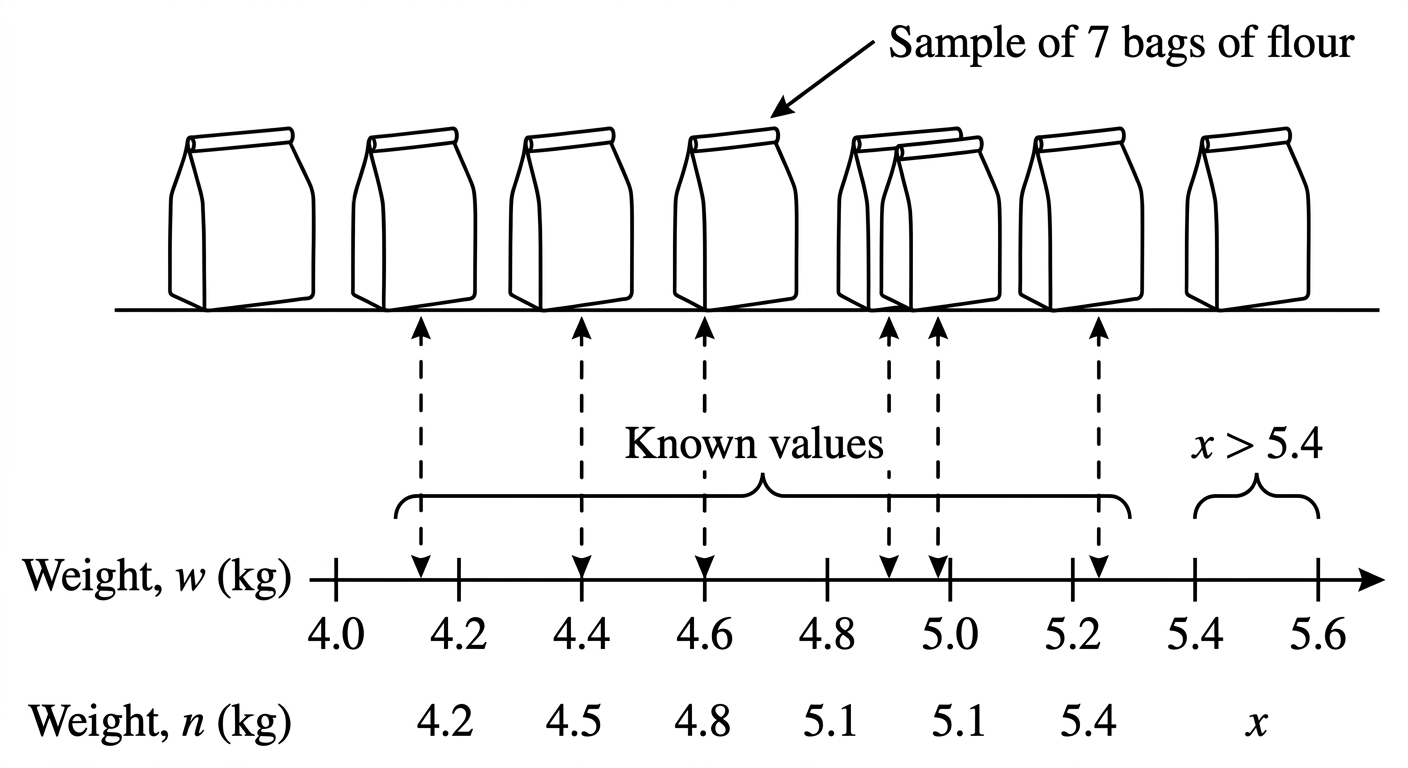
The weights, in kilograms, of six bags of flour are:
where .
(a)
Show that the mean weight of the six bags is kg. [2 marks]
(b)
Given that the mean weight is kg, find the value of . [2 marks]
(c)
A seventh bag is added. The mean of all seven bags remains kg. Find the weight of the seventh bag and determine whether the mode of all seven weights differs from the mode of the original six bags. Justify your answer. [3 marks]
Solutions
3ChallengeSAQ-LBox plots and histogramss8 marksPaper 1~12 min
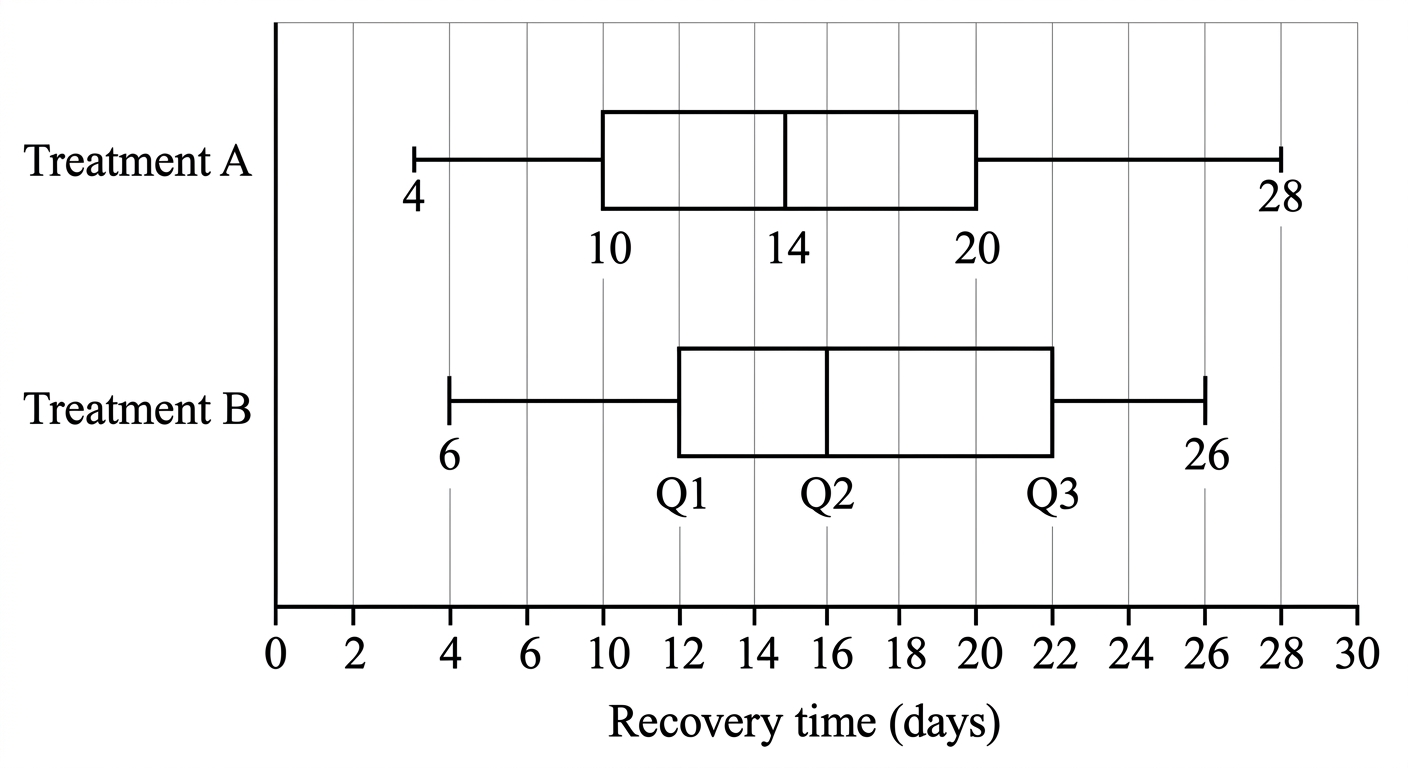
A medical researcher investigates recovery times (in days) for two treatments for a specific illness. Treatment A was given to 30 patients and Treatment B to 25 patients. Their recovery times are summarised in the box plots below.
(a)
Calculate the interquartile range for each treatment. [2 marks]
(b)
Using Pearson's quartile coefficient of skewness,
calculate for each treatment and state which distribution is more skewed. [3 marks]
(c)
The combined data from both treatments are displayed in a histogram with six bins of equal width starting at 0 days. The frequencies are:
Interval (days) — — — — — —
Frequency — 3 — 9 — 15 — 14 — 11 — 3
Determine whether thistogram is consistent with the two individual box plots. In your answer, check the total number of patients, the range, and the position of the combined median. [3 marks]
Solutions
That's every free question here — 3 of 256.
+253 more questions, plus Mock Papers & Worksheets, are waiting in Premium.