You're viewing 1 free preview question for Maths AA HL — subscribe to unlock 11 more, plus the Full Question Bank, Mock Papers & Worksheets.Upgrade
Descriptive Statistics · Paper 3 — Free Maths AA HL Practice Questions
1ChallengeLAQBox plots and histogramss10 marksPaper 3~15 min

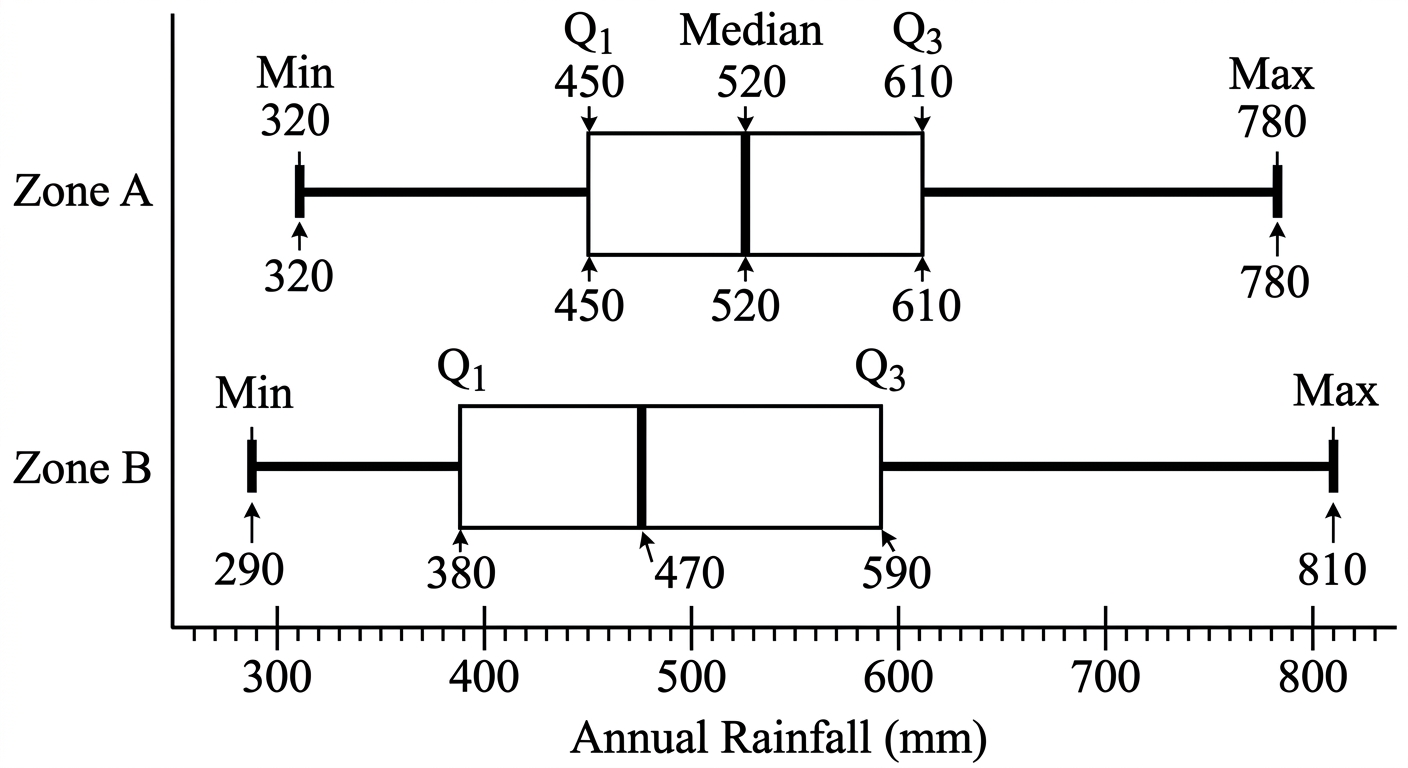
A researcher studies annual rainfall (in mm) in two climate zones. Summary statistics from box plots are given below.
Zone A — 320 — 450 — 520 — 610 — 780
Zone B — 290 — 380 — 470 — 590 — 810
(a)
For Zone A, calculate the interquartile range (IQR) and the range. [2 marks]
(b)
A researcher claims that neither zone's rainfall data is symmetrically distributed. For each zone, calculate
and the ratio of upper whisker length to lower whisker length. Hence evaluate the researcher's claim, stating the direction of skew for each zone. [5 marks]
(c)
A histogram of Zone A's rainfall is constructed using 8 equal-width bins spanning to . The total frequency is 100. Assuming rainfall is uniformly distributed within each inter-quartile interval, show that the frequency density of the bin is approximately , and hence prove that this frequency density is less than . [3 marks]

Solutions
That's every free question here — 1 of 12.
+11 more questions, plus Mock Papers & Worksheets, are waiting in Premium.