You're viewing 1 free preview question for Maths AI HL — subscribe to unlock 14 more, plus the Full Question Bank, Mock Papers & Worksheets.Upgrade
Descriptive Statistics · Paper 3 — Free Maths AI HL Practice Questions
1ChallengeLAQMeasures of central tendency (mean, median, mode)9 marksPaper 3~14 min

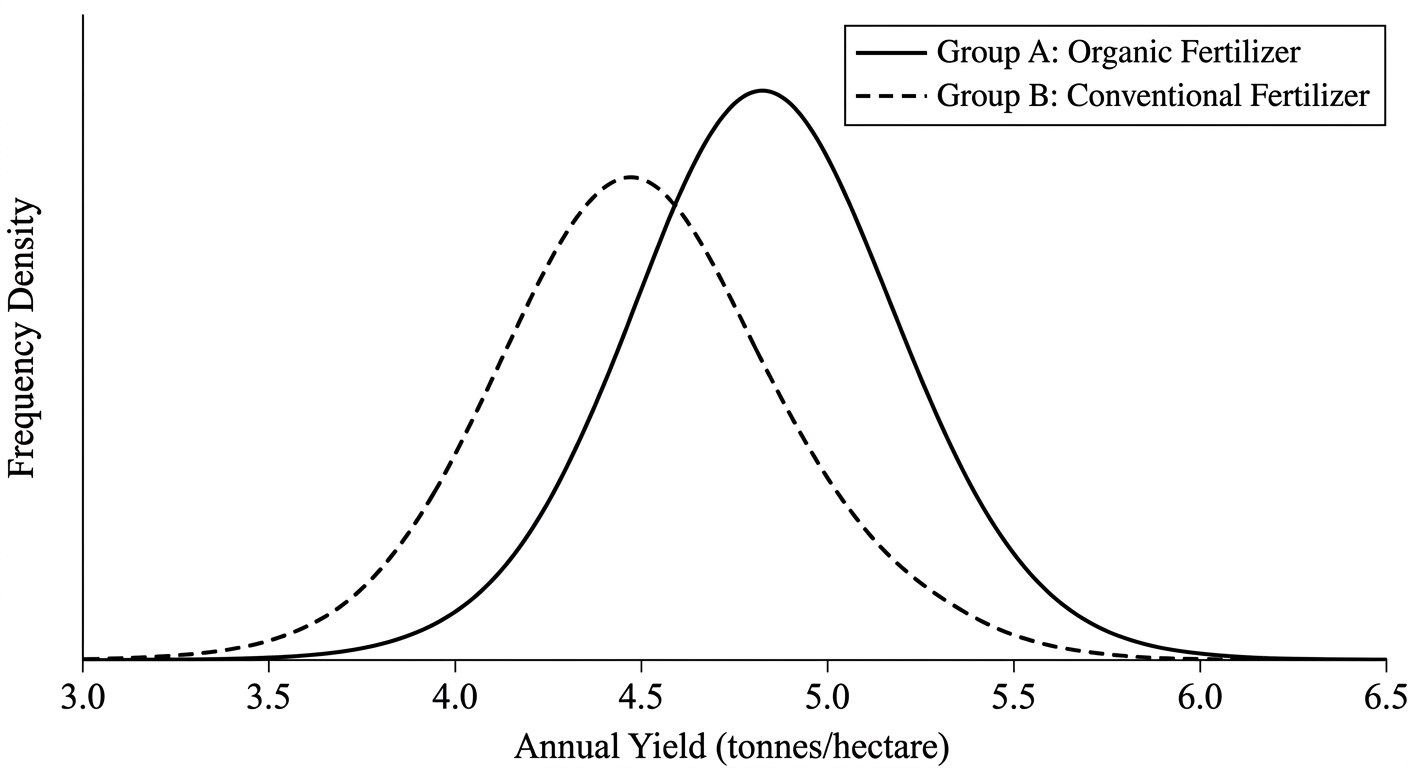
A large-scale agricultural study investigates the relationship between a new organic fertilizer and crop yield. For randomly selected farms, the annual yield (in tonnes per hectare) is recorded. Each farm uses either the organic fertilizer (Group A) or a conventional synthetic fertilizer (Group B).
- Group A ( farms): mean , standard deviation , median , mode (all in tonnes per hectare)
- Group B ( farms): mean , standard deviation , median , mode (all in tonnes per hectare)
(a)
Show that the combined mean yield for all farms is tonnes per hectare. [2 marks]
(b)
Calculate the difference (mean median) for Group A and for Group B. [2 marks]
(c)
A researcher claims: "The median is a more representative measure of central tendency than the mean for comparing these two groups, because the mean is sensitive to extreme values."
Using your results from part (b) and the concept of skewness, evaluate this claim. [3 marks]
(d)
A new farm, Farm X, which uses the organic fertilizer and has a yield of tonnes per hectare, is added to Group A.
(i) Calculate the new mean of Group A (now farms). [1]
(ii) Determine the new median of Group A and hence show that the mean increases by more than the median increases. [2 marks]
(ii) Determine the new median of Group A and hence show that the mean increases by more than the median increases. [2 marks]

Solutions
That's every free question here — 1 of 15.
+14 more questions, plus Mock Papers & Worksheets, are waiting in Premium.