You're viewing free preview questions. Upgrade to access more Physics SL questions.Upgrade
Kinematics · Paper 2 — Free Physics SL Practice Questions
1MasterySAQ-SDisplacement, velocity, and acceleration7 marksPaper 2~11 min

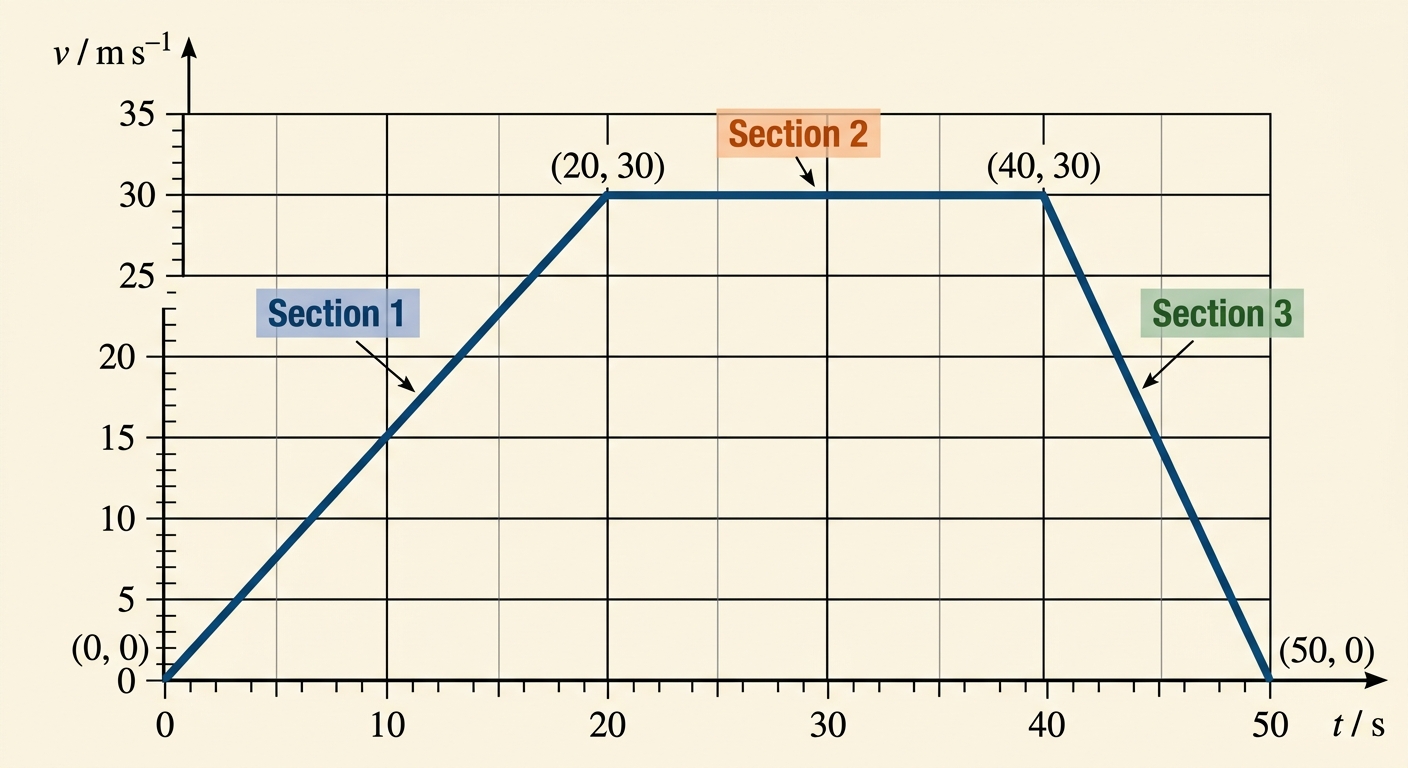
A train moves along a straight track. The velocity–time graph for the train over a journey is shown below.
The graph shows three sections:
- Section 1 — straight line from to
- Section 2 — horizontal line from to
- Section 3 — straight line from to
The vertical axis is labelled (range to ) and the horizontal axis is labelled (range to ).
(a)
Calculate the acceleration of the train during Section 1 and during Section 3. [2 marks]
(b)
Determine the total displacement of the train over the entire journey. [2 marks]
(c)
The driver claims the train travelled a total distance of more than during this journey. Evaluate this claim, justifying why distance and displacement are equal in this case. [3 marks]

Solutions
2MasterySAQ-SScalars and vectors7 marksPaper 2~11 min
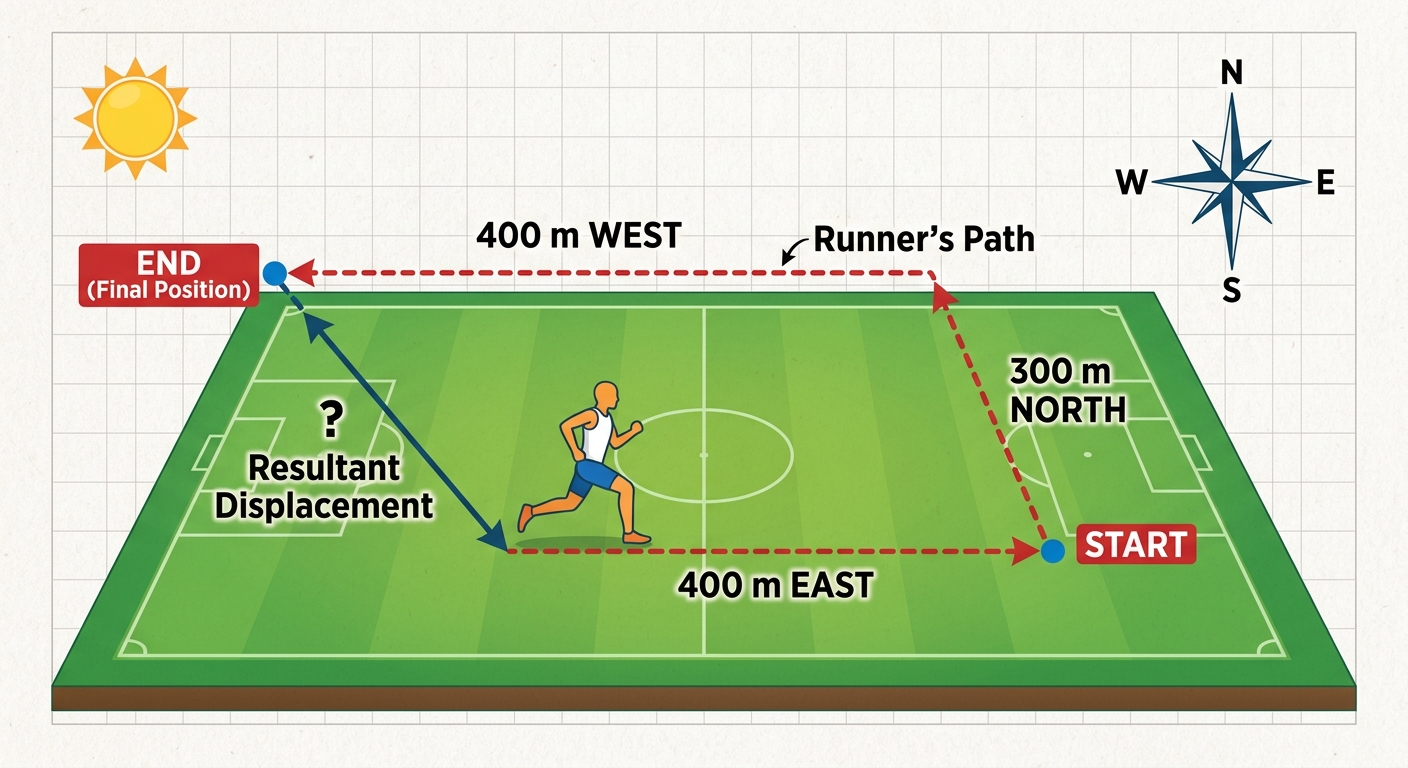
A runner completes a route: 400 m east, then 300 m north. The total time taken is 200 s.
(a)
State the total distance travelled by the runner. [1 mark]
(b)
Calculate the magnitude and direction of the runner's displacement from the starting point. [2 marks]
(c)
Calculate the average speed and the average velocity of the runner for this route. [2 marks]
(d)
The runner claims that average speed and average velocity are the same quantity expressed in different units. Deduce, using your answers to (b) and (c), whether this claim is correct.
You may use: [2 marks]
Solutions
3MasterySAQ-SGraphical analysis of motion7 marksPaper 2~11 min
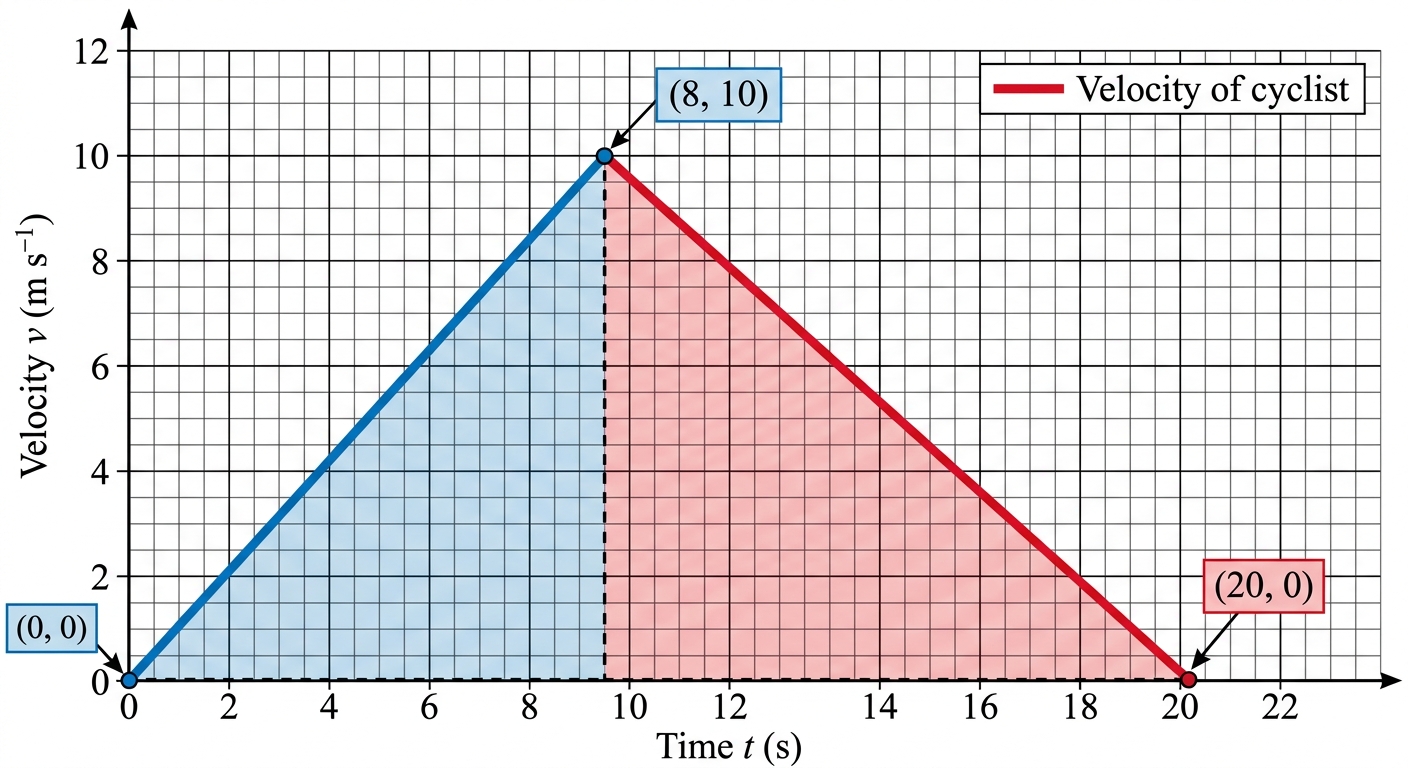
A cyclist travels along a straight road. The velocity-time graph of the cyclist is shown below.
(a)
Identify the type of acceleration experienced by the cyclist during the first 8 seconds, and state one piece of evidence from the graph that supports your answer. [2 marks]
(b)
Calculate the acceleration of the cyclist during the time interval to . [2 marks]
(c)
Determine the total distance travelled by the cyclist over the full 20 seconds. [2 marks]
(d)
Explain whether the magnitude of the average velocity equals the average speed over the 20-second interval. [1 mark]
Solutions
4MasterySAQ-SScalars and vectors7 marksPaper 2~11 min
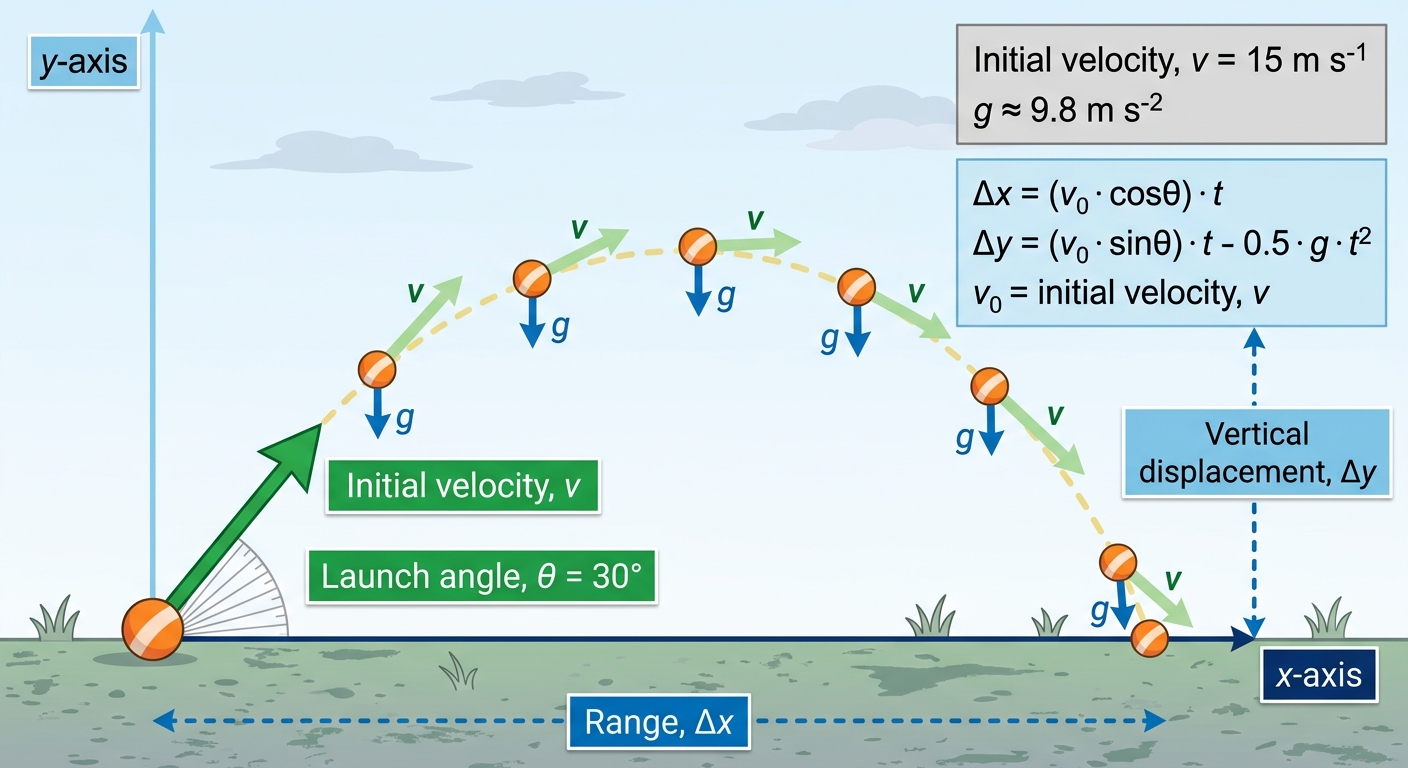
Data
; ; ; ; ;
A ball is launched with an initial speed of at an angle of above the horizontal.
(a)
Explain why the initial velocity must be resolved into horizontal and vertical components before applying kinematic equations. [2 marks]
(b)
Calculate the vertical component of the initial velocity. [2 marks]
(c)
The launch angle is increased to while the initial speed remains . Determine the new horizontal and vertical components and state how each has changed compared to the case. [3 marks]
Solutions
5MasterySAQ-SScalars and vectors7 marksPaper 2~11 min
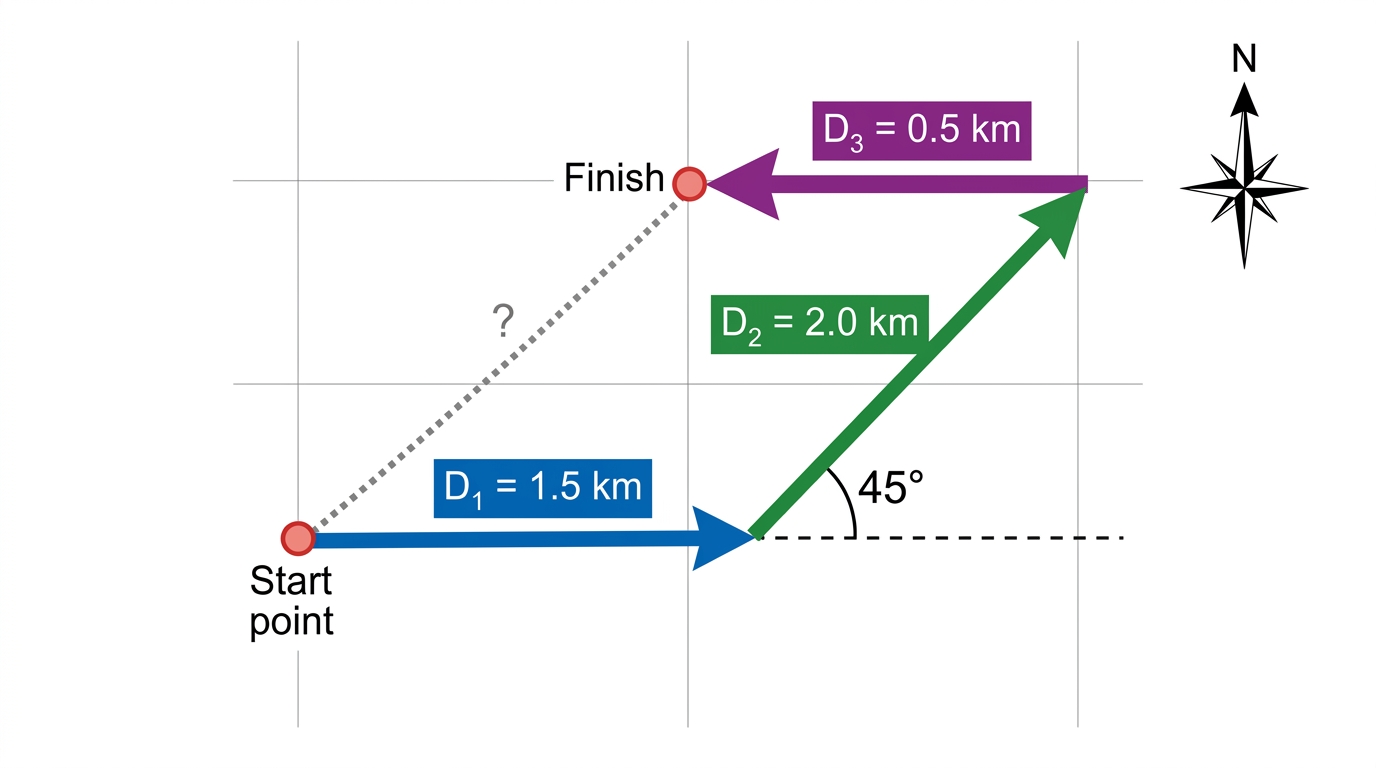
A hiker starts from point O. She walks 1.5 km due east, then 2.0 km in the direction 45° north of east, then 0.5 km due west.
(a)
Determine the east–west and north–south components of the hiker's resultant displacement. [2 marks]
(b)
Calculate the magnitude of the hiker's resultant displacement from O. [2 marks]
(c)
The hiker claims she could reach the same final position by walking due north first, then due east. Deduce the order and distances of these two legs, and state whether the total distance walked would be greater than, equal to, or less than the original 4.0 km. [3 marks]
Solutions
6MasterySAQ-SScalars and vectors5 marksPaper 2~8 min
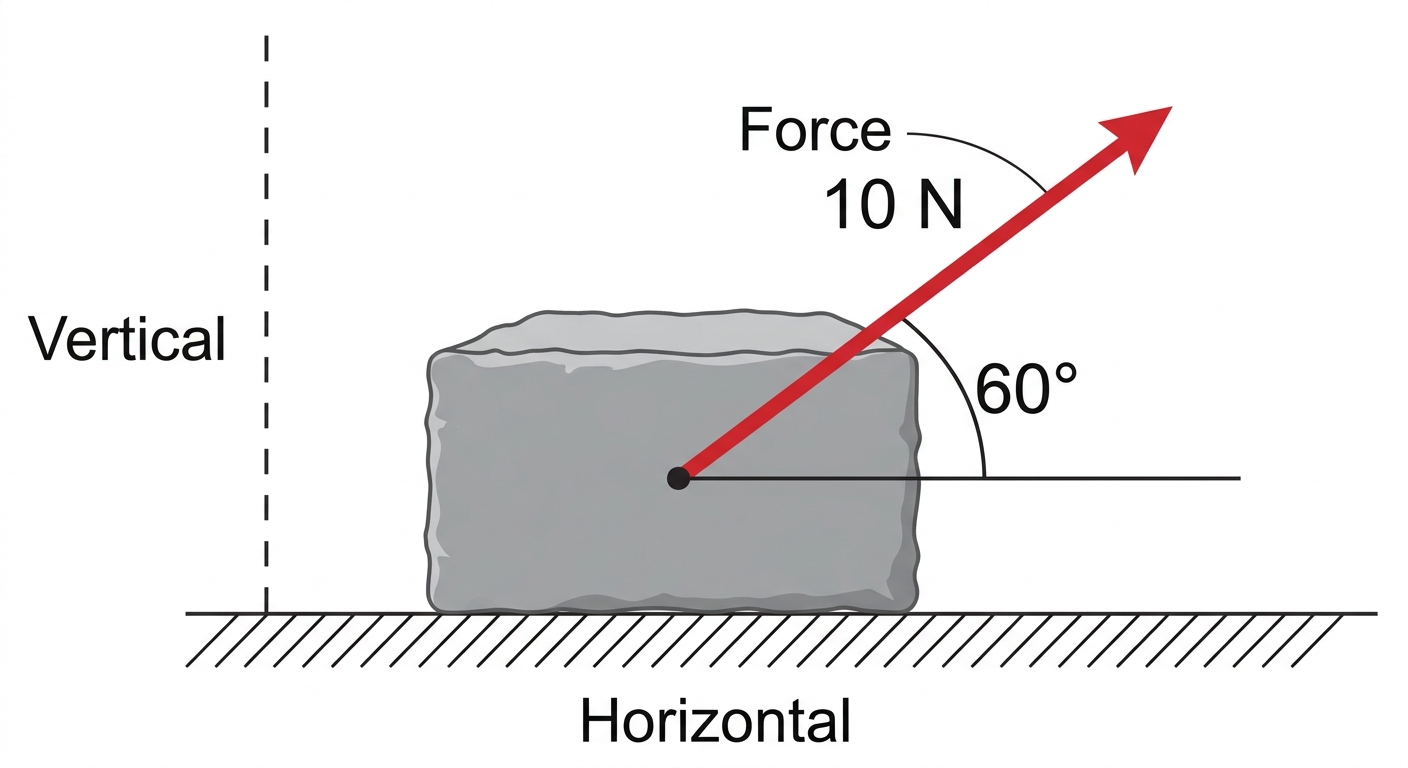
A force of magnitude 10 N acts on an object at an angle of 60° above the horizontal.
(a)
State what is meant by resolving a vector into two perpendicular components. [1 mark]
(b)
Calculate the horizontal and vertical components of the force. [2 marks]
(c)
The object rests on a horizontal surface. The vertical component of the force reduces the normal reaction force on the object. Deduce the value of , given that the object has a weight of 12 N. [2 marks]
Solutions
7MasterySAQ-SDisplacement, velocity, and acceleration6 marksPaper 2~9 min
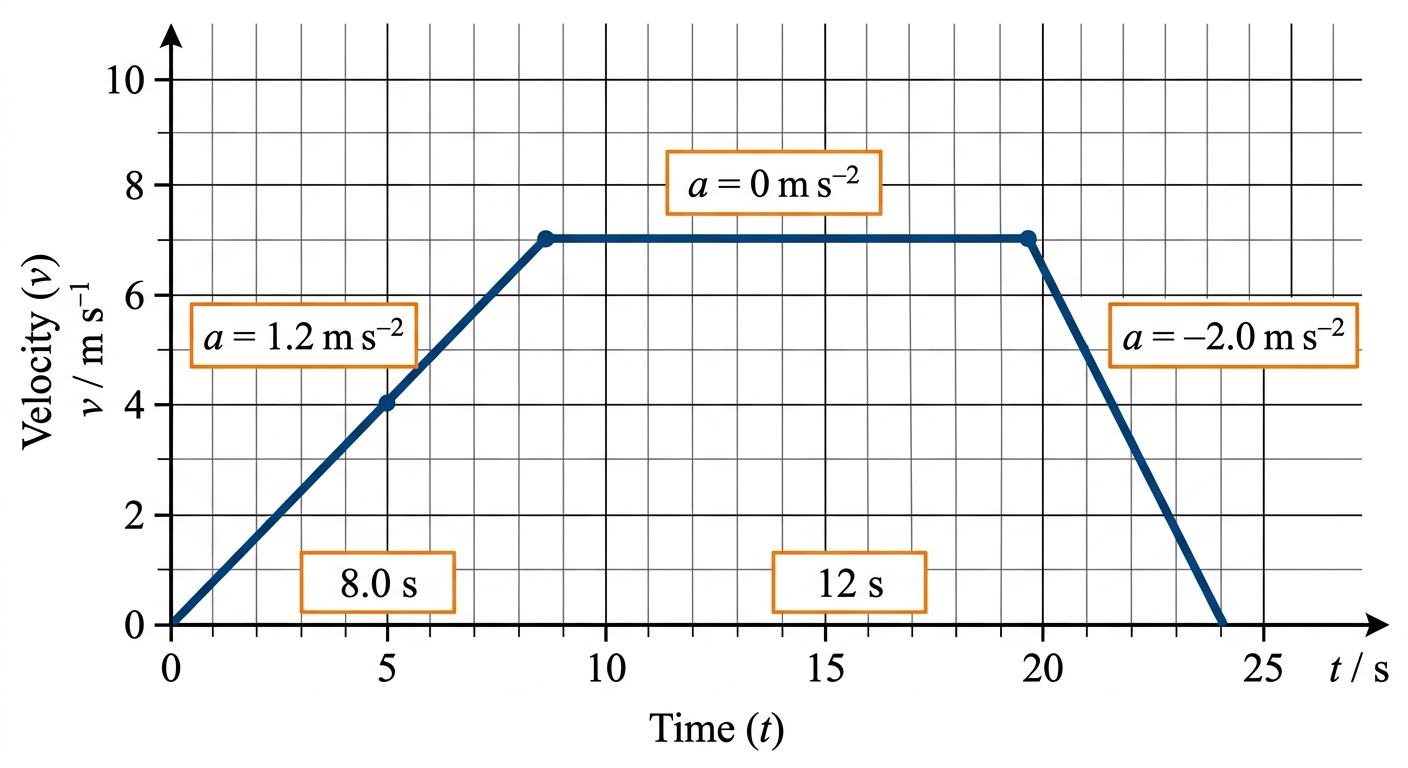
A cyclist is training on a straight, flat road. She starts from rest and accelerates uniformly at for . She then maintains a constant velocity for . Finally, she applies the brakes and decelerates uniformly at until she comes to rest.
(a)
(i) State the relationship between the gradient of a velocity–time graph and acceleration. [1]
(ii) Explain what a negative gradient on a velocity–time graph indicates about the motion of the cyclist. [1 mark]
(ii) Explain what a negative gradient on a velocity–time graph indicates about the motion of the cyclist. [1 mark]
(b)
Calculate the total distance travelled by the cyclist. [3 marks]
(c)
The cyclist claims that, had she decelerated at instead of , her total journey distance would have been reduced by more than . Determine whether this claim is correct. [2 marks]
Solutions
8MasterySAQ-SDisplacement, velocity, and acceleration4 marksPaper 2~6 min
A ball is thrown vertically upward from ground level with an initial speed of . Air resistance is negligible. Take upward as positive and .
(a)
(i) State the velocity of the ball at the highest point of its motion. [1]
(ii) State the acceleration of the ball at the highest point of its motion, including its direction. [1 mark]
(ii) State the acceleration of the ball at the highest point of its motion, including its direction. [1 mark]
(b)
Calculate the displacement of the ball from its launch point at after release. [3 marks]
Solutions
9MasterySAQ-SGraphical analysis of motion4 marksPaper 2~6 min
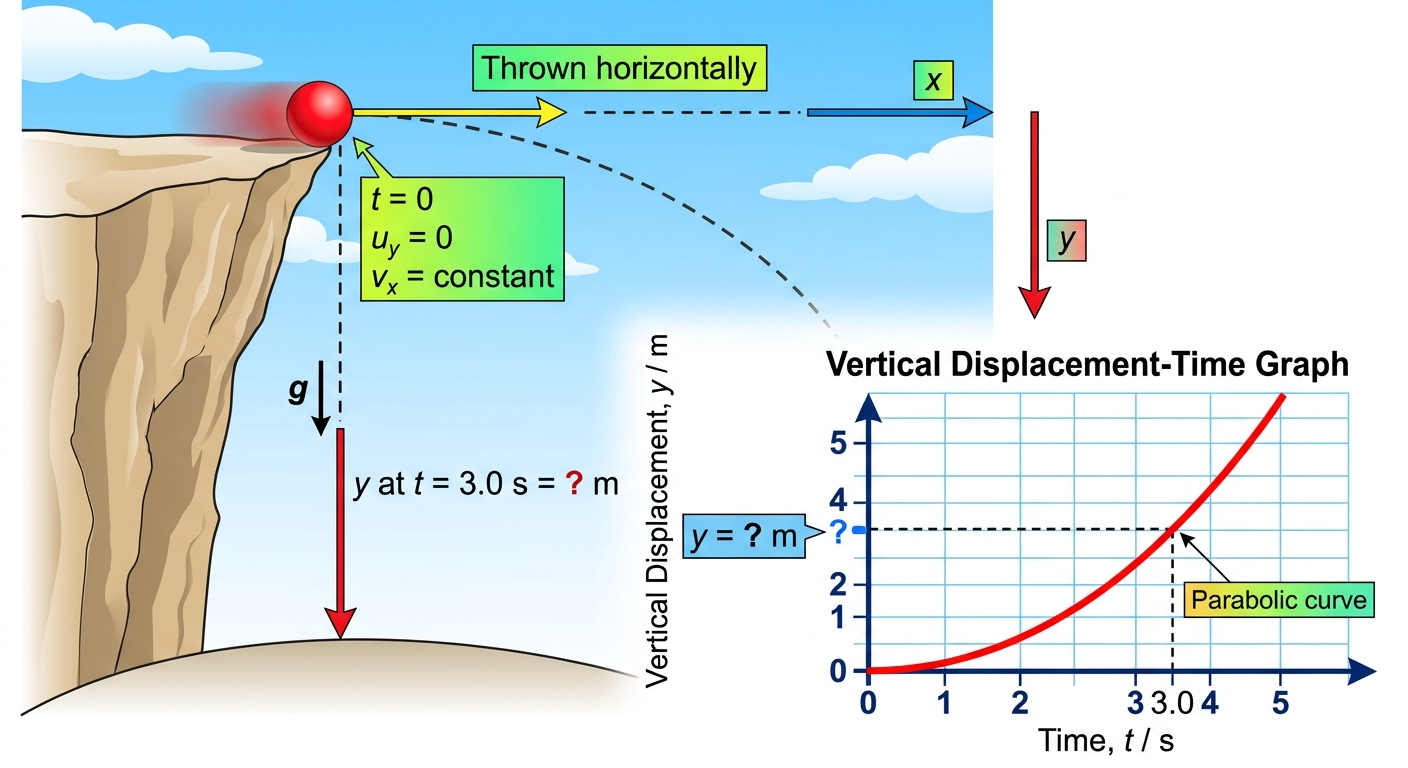
A ball is thrown horizontally from a cliff. The horizontal displacement–time graph is a straight line through the origin with gradient . The vertical displacement–time graph is a parabola. The ball is initially at rest in the vertical direction.
(a)
(i) State what the gradient of the horizontal displacement–time graph represents. [1]
(ii) State what the shape of the horizontal displacement–time graph tells you about the horizontal acceleration of the ball. [1 mark]
(ii) State what the shape of the horizontal displacement–time graph tells you about the horizontal acceleration of the ball. [1 mark]
(b)
Calculate the vertical displacement of the ball after . [3 marks]
Solutions
10MasterySAQ-SScalars and vectors4 marksPaper 2~6 min
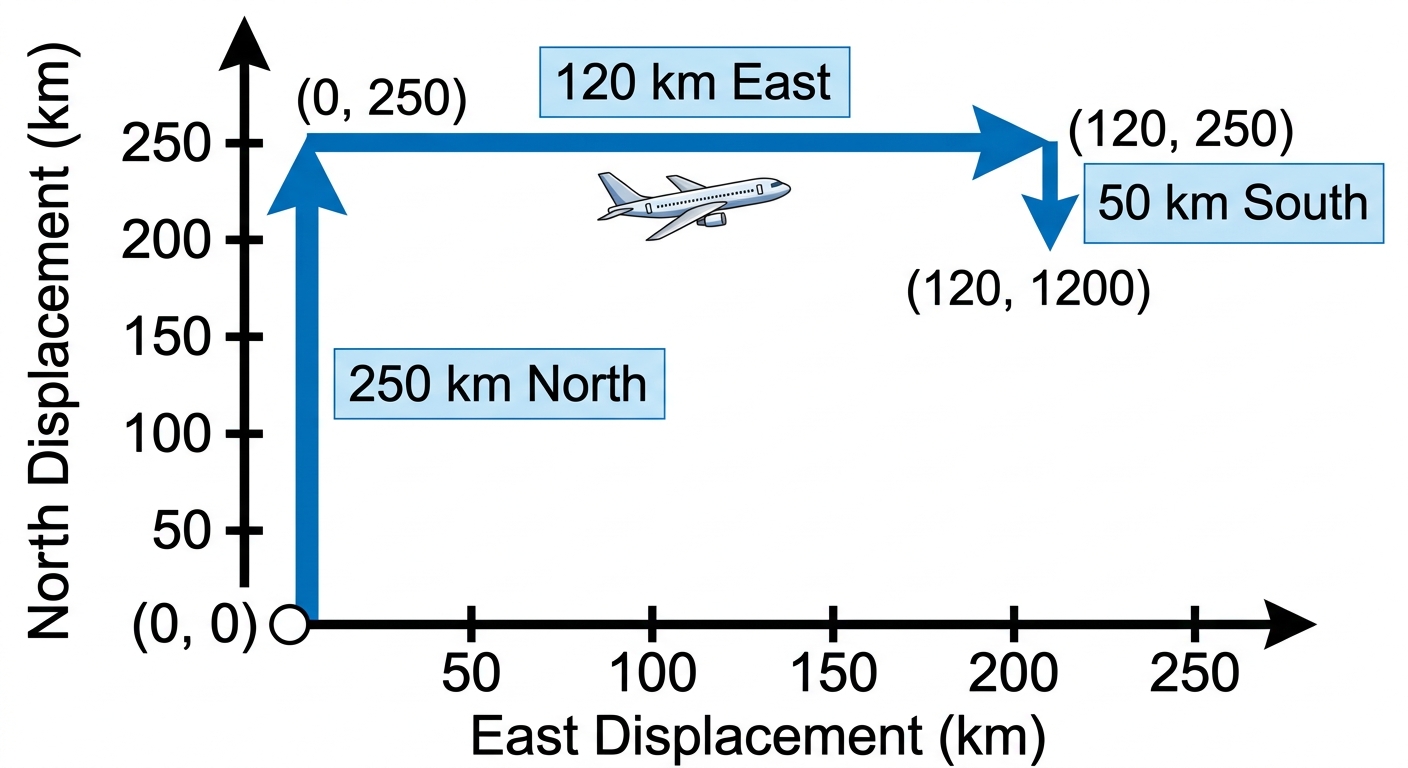
A plane flies 250 km north, then 120 km east, then 50 km south.
(a)
(i) State what is meant by a vector quantity. [1]
(ii) Identify the displacement of the plane during the first leg of the journey, stating both its magnitude and direction. [1 mark]
(ii) Identify the displacement of the plane during the first leg of the journey, stating both its magnitude and direction. [1 mark]
(b)
Calculate the magnitude of the plane's resultant displacement from its starting point. [3 marks]
Solutions
11MasterySAQ-SGraphical analysis of motion6 marksPaper 2~9 min
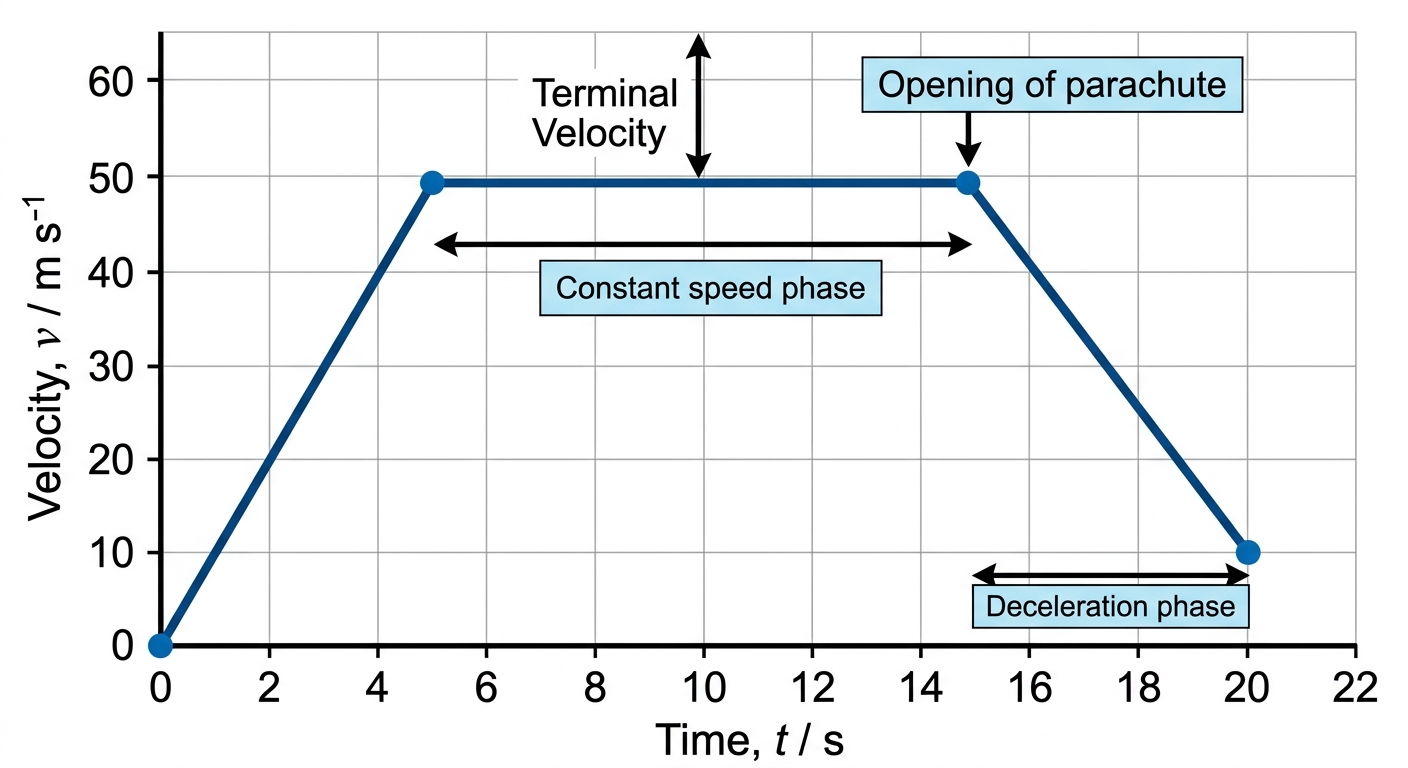
A skydiver jumps from a stationary balloon and falls vertically downward. The velocity-time graph of the skydiver is shown below.
(a)
(i) State the type of motion of the skydiver during the first 5 seconds. [1]
(ii) Calculate the acceleration of the skydiver during the first 5 seconds. [1 mark]
(ii) Calculate the acceleration of the skydiver during the first 5 seconds. [1 mark]
(b)
Calculate the distance fallen by the skydiver during the first 5 seconds. [2 marks]
(c)
The magnitude of the skydiver's acceleration during the first 5 seconds is less than . Explain why this is the case. [1 mark]
(d)
The skydiver has a mass of 75 kg. Determine the magnitude of the air resistance force acting on the skydiver during the first 5 seconds. [2 marks]
Solutions
12MasterySAQ-SGraphical analysis of motion6 marksPaper 2~9 min
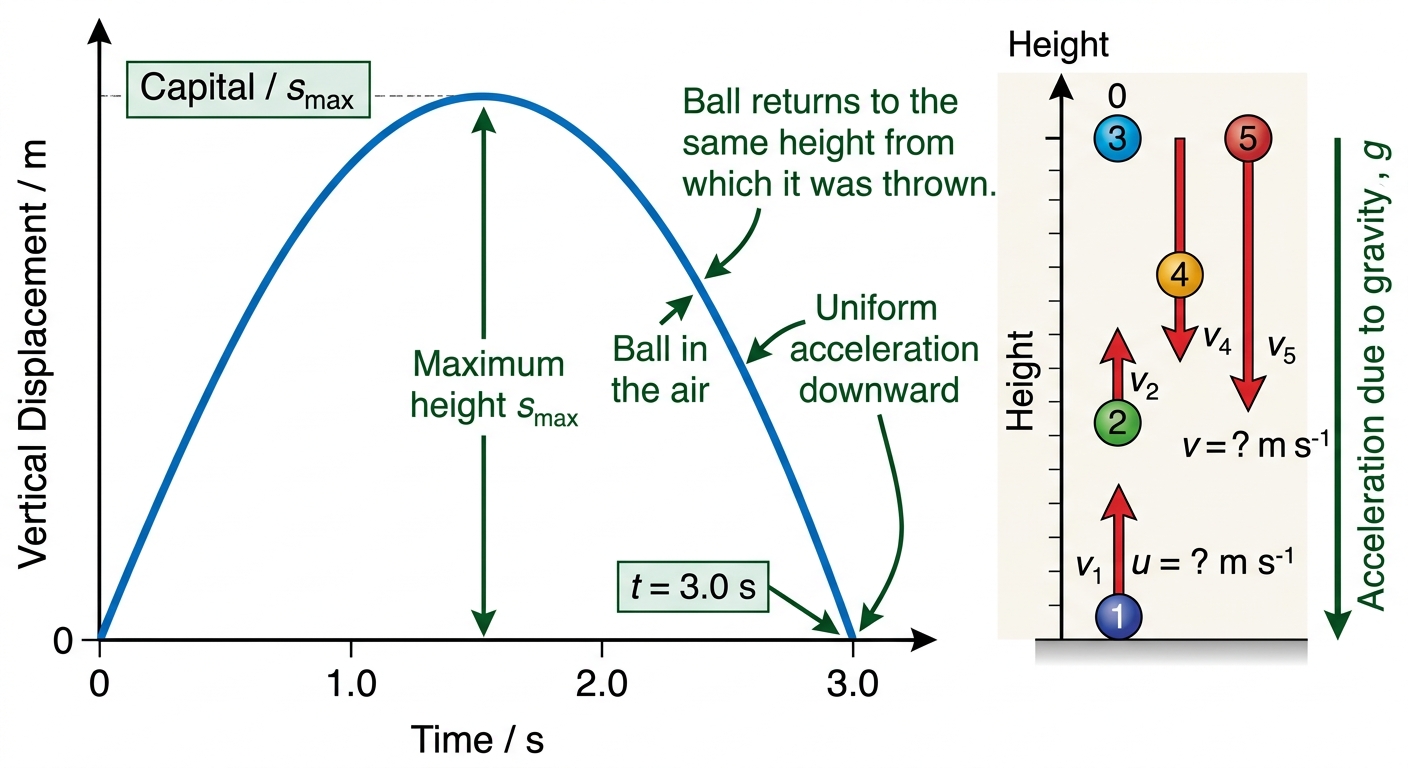
A student throws a ball vertically upwards. The ball leaves the student's hand and returns to the same height. The ball is in the air for .
(a)
Describe the velocity-time graph for the ball's motion from launch to return, including the sign and relative magnitudes of the initial and final velocities. [2 marks]
(b)
Calculate the initial speed of the ball. [2 marks]
(c)
The student claims that air resistance is negligible. State one piece of evidence from the motion described that supports this claim, and explain how the evidence supports it. [2 marks]
Solutions
13MasterySAQ-SEquations of motion (constant acceleration)7 marksPaper 2~11 min
A drone descends vertically from rest with a constant downward acceleration of . After of descent, the drone's motors malfunction and it falls freely under gravity () for a further before hitting the ground.
(a)
State the velocity of the drone at the moment the motors malfunction, including its direction. [1 mark]
(b)
Calculate the total vertical distance fallen from the start of the descent to the ground. [3 marks]
(c)
Determine the speed of the drone at the moment of impact and hence evaluate whether the drone falls a greater distance during the powered phase or the free-fall phase. [3 marks]
Solutions
14MasterySAQ-SGraphical analysis of motion7 marksPaper 2~11 min
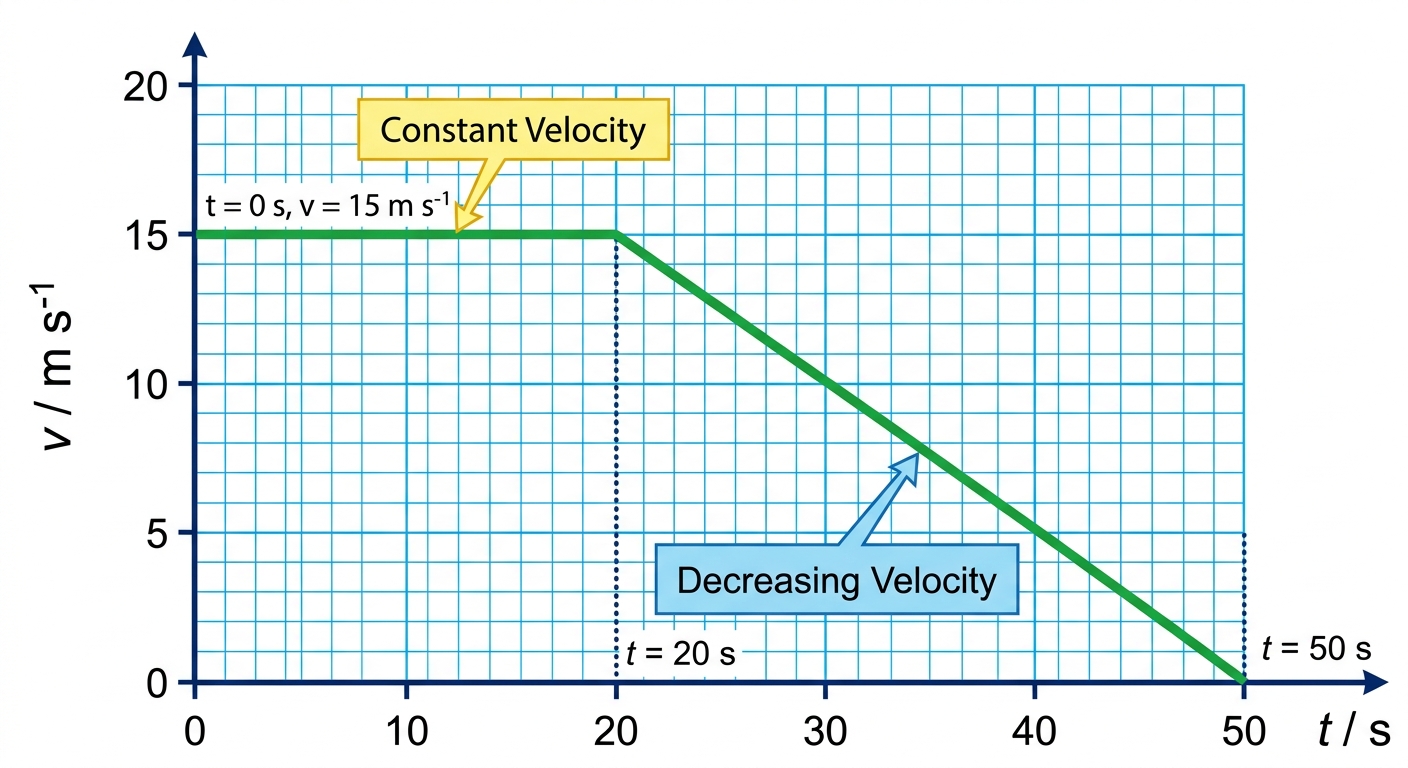
A train of mass travels along a straight, horizontal track. Its velocity-time graph shows a horizontal line at for the first 20 s, then a straight line decreasing to at s.
(a)
Describe the motion of the train during each phase of the 50 s journey. [2 marks]
(b)
Calculate the total distance travelled by the train during the 50 s journey. [3 marks]
(c)
Determine the magnitude of the net braking force acting on the train between s and s. [2 marks]
Solutions
15MasterySAQ-SGraphical analysis of motion7 marksPaper 2~11 min
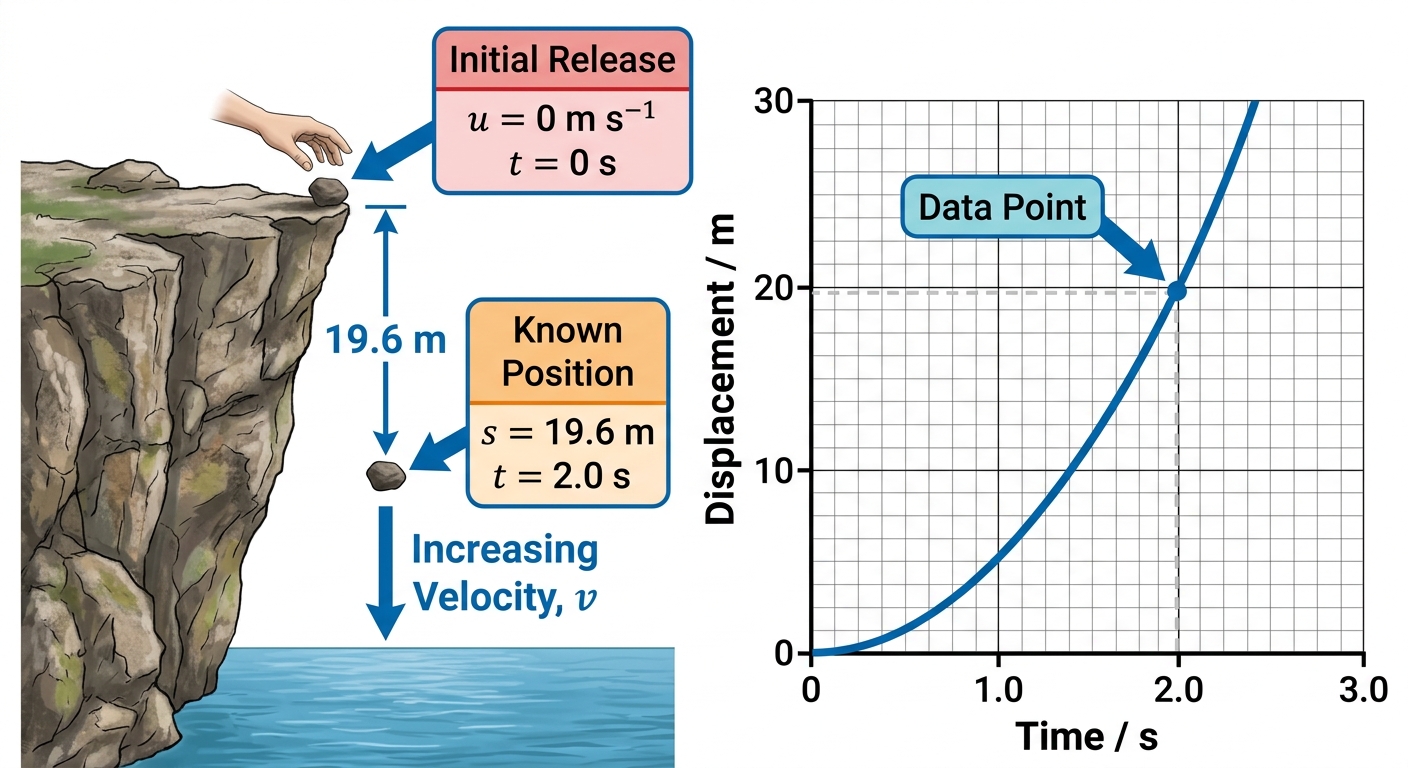
A stone is dropped from rest from the top of a cliff. Air resistance is negligible. After , the stone has fallen .
Take downward.
(a)
Describe how the gradient of the displacement–time graph changes as the stone falls, and explain why. [2 marks]
(b)
The average velocity of the stone over the first is calculated using .
Calculate and then determine the instantaneous velocity of the stone at . [3 marks]
(c)
The average velocity is not equal to the instantaneous velocity at . Explain why these two values differ, and state at what point during the fall the instantaneous velocity equals . [2 marks]
Solutions
16MasterySAQ-SGraphical analysis of motion8 marksPaper 2~12 min
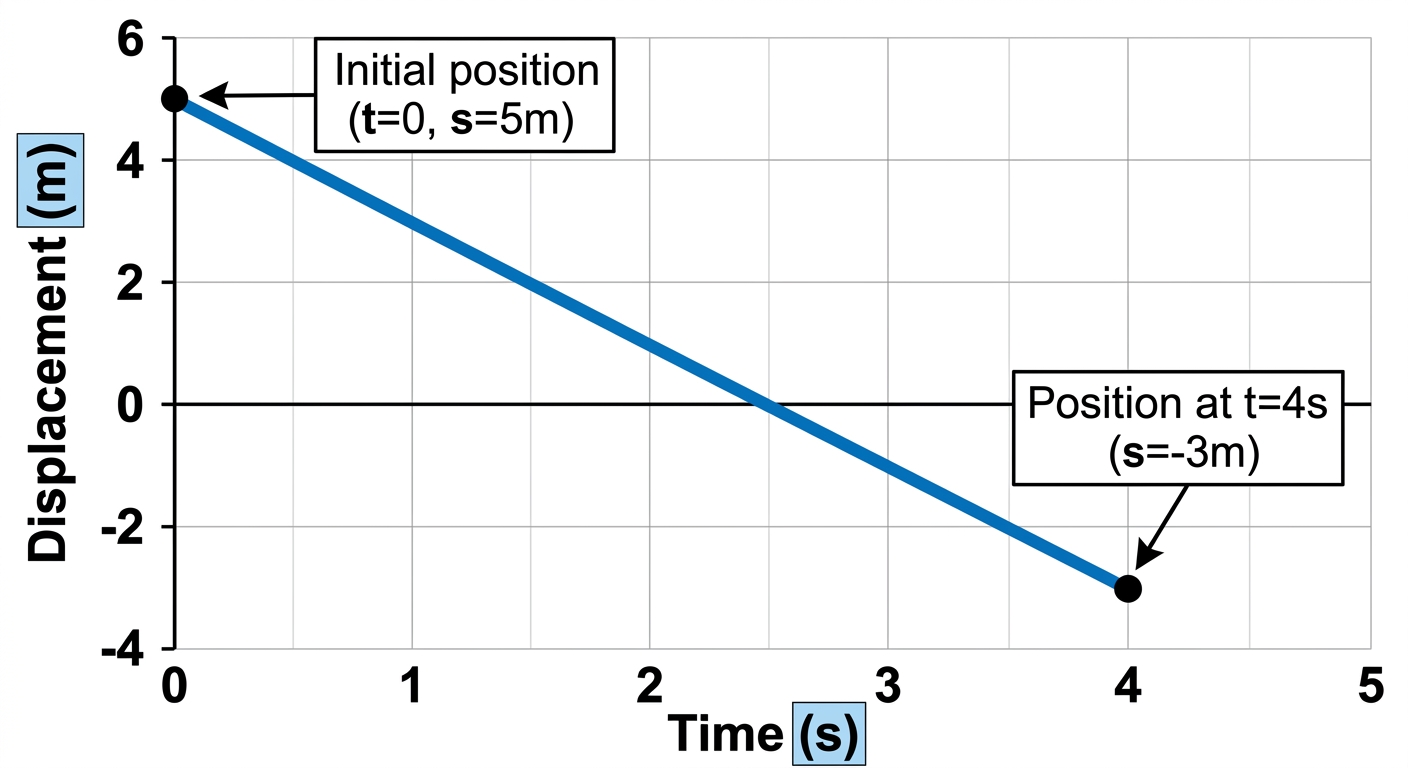
A particle moves along a straight line. Its displacement from a fixed point O is given by the displacement–time graph, which is a straight line passing through the points and , where displacement is in metres and time is in seconds.
(a)
Calculate the velocity of the particle. [2 marks]
(b)
Determine the time at which the particle passes through O. [2 marks]
(c)
The particle continues with the same velocity beyond . Evaluate whether the total distance travelled by the particle from to equals the magnitude of its displacement over the same interval. Justify your answer. [4 marks]
Solutions
17MasterySAQ-SEquations of motion (constant acceleration)6 marksPaper 2~9 min
A drone is hovering stationary at a height of 45 m above the ground. It then accelerates uniformly downwards at for 2.0 s, after which it continues with constant velocity until it reaches the ground.
(a)
State the initial velocity of the drone at the moment it begins to accelerate. [1 mark]
(b)
Calculate the velocity of the drone at the end of the 2.0 s acceleration phase. [1 mark]
(c)
Calculate the total time taken for the drone to reach the ground from the moment it starts accelerating. [2 marks]
(d)
The drone's motors provide a constant upward thrust during the constant-velocity phase. Evaluate whether this phase is consistent with Newton's first law, and deduce the relationship between the thrust force and the drone's weight during this phase. [2 marks]
Solutions
18MasterySAQ-SEquations of motion (constant acceleration)4 marksPaper 2~6 min
A car accelerates uniformly along a straight track. It passes point A with a velocity of and point B with a velocity of . The distance between A and B is .
(a)
State what is meant by uniform acceleration. [1 mark]
(b)
Calculate the acceleration of the car between A and B. [2 marks]
(c)
(i) Describe how the displacement of the car from point A varies with time . [1]
(ii) Explain why this relationship between and has the form you described. [1 mark]
(ii) Explain why this relationship between and has the form you described. [1 mark]
Solutions
19MasterySAQ-SDisplacement, velocity, and acceleration6 marksPaper 2~9 min
Data
, , ,
A stone is released from rest and falls vertically from a bridge. The stone strikes the water surface after release. Air resistance is negligible.
(a)
Describe the relationship between the displacement of the stone and the time elapsed during the fall. [2 marks]
(b)
Calculate the speed of the stone at the instant it reaches the water surface. [2 marks]
(c)
Deduce whether the speed of the stone would be greater than, equal to, or less than the value calculated in (b) if air resistance were not negligible. Justify your answer. [2 marks]
Solutions
20MasterySAQ-SDisplacement, velocity, and acceleration6 marksPaper 2~9 min
Data
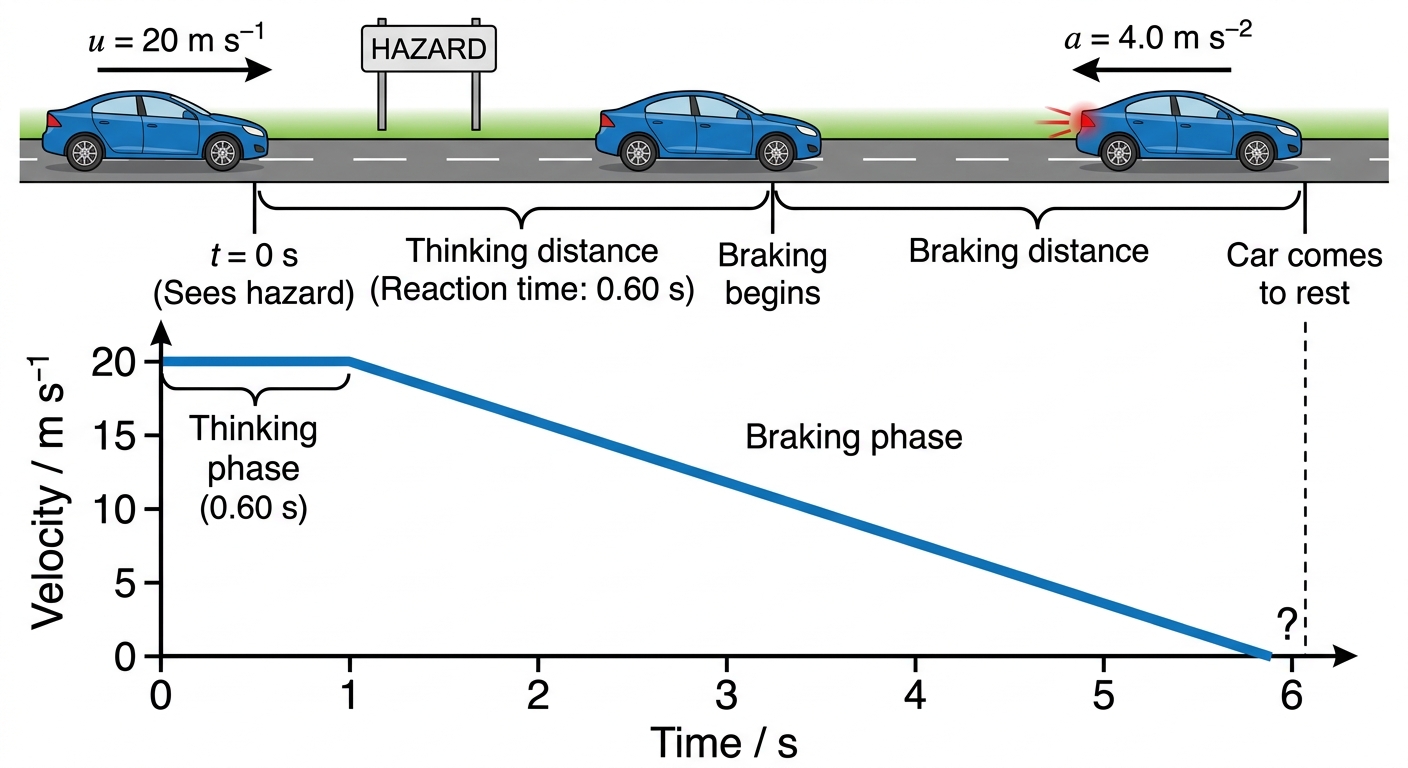
A car travels along a straight road at . The driver sees a hazard and, after a reaction time of , applies the brakes. The brakes produce a constant deceleration of until the car stops.
(a)
Define instaneous velocity. [1 mark]
(b)
Calculate the total distance travelled from the moment the driver sees the hazard until the car stops. [3 marks]
(c)
A road-safety report states that doubling the reaction time has a greater effect on total stopping distance than doubling the deceleration magnitude. Evaluate this claim using your results from (b). [2 marks]
Solutions
Showing 20 of 141 free questions