You're viewing free preview questions — 4 questions previewing here — subscribe to unlock 12 more, plus the Full Question Bank, Mock Papers & Worksheets.Upgrade
Using Tree Diagrams and Venn Diagrams Introductory — Free MYP1 Mathematics Practice Questions

1QuestionCalculating Basic Probabilities Using Tree DiagramsConcept Practice
2 marks~3 minCriterion A
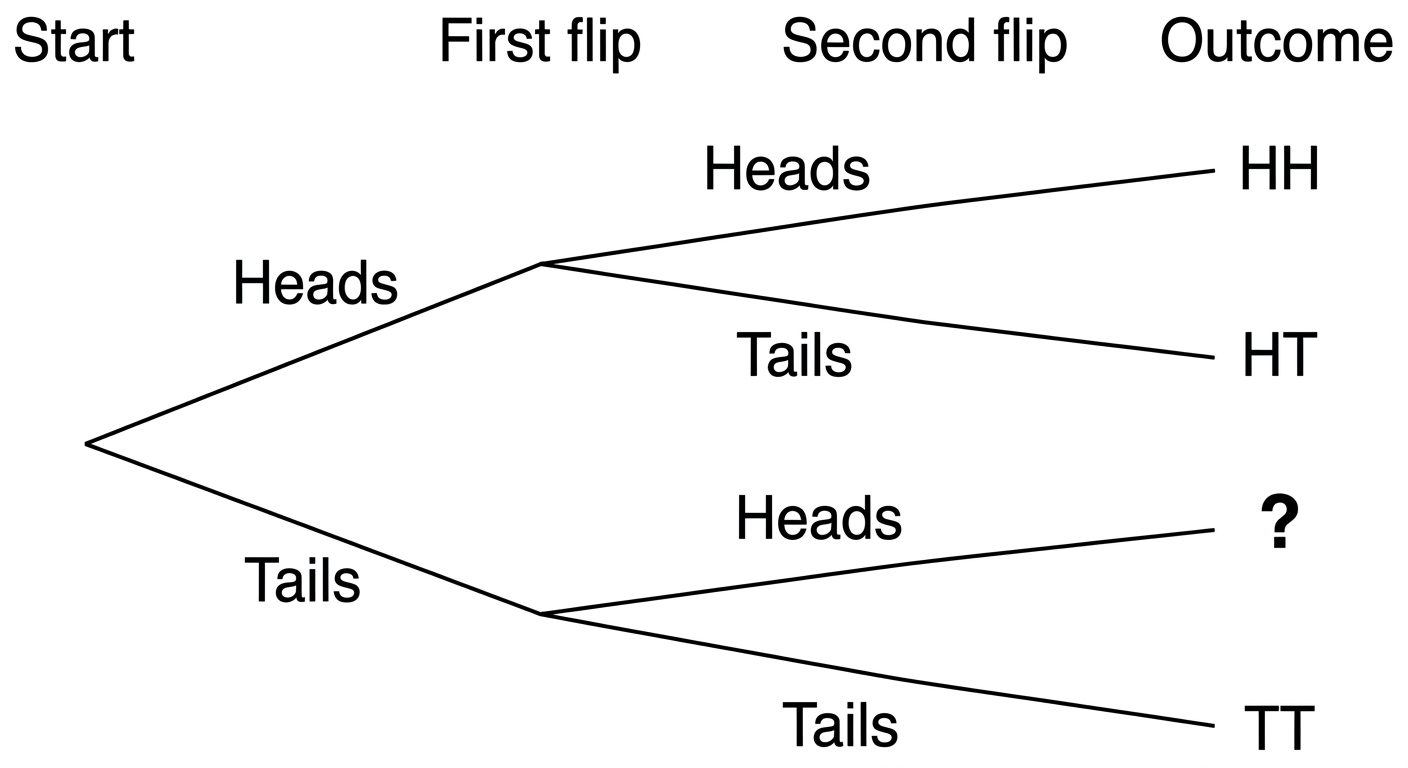
The tree diagram shows all the outcomes when a fair coin is flipped twice. One outcome is missing.
First flip: Heads → Second flip: Heads → Outcome:
First flip: Heads → Second flip: Tails → Outcome:
First flip: Tails → Second flip: Heads → Outcome:
First flip: Tails → Second flip: Tails → Outcome:
First flip: Heads → Second flip: Heads → Outcome:
First flip: Heads → Second flip: Tails → Outcome:
First flip: Tails → Second flip: Heads → Outcome:
First flip: Tails → Second flip: Tails → Outcome:
a
Identify the pattern used to write each outcome. [1]
b
State the missing outcome. [1]

Solutions
2QuestionInterpreting Simple Venn DiagramsAssessment Practice
6 marks~9 minCriterion D
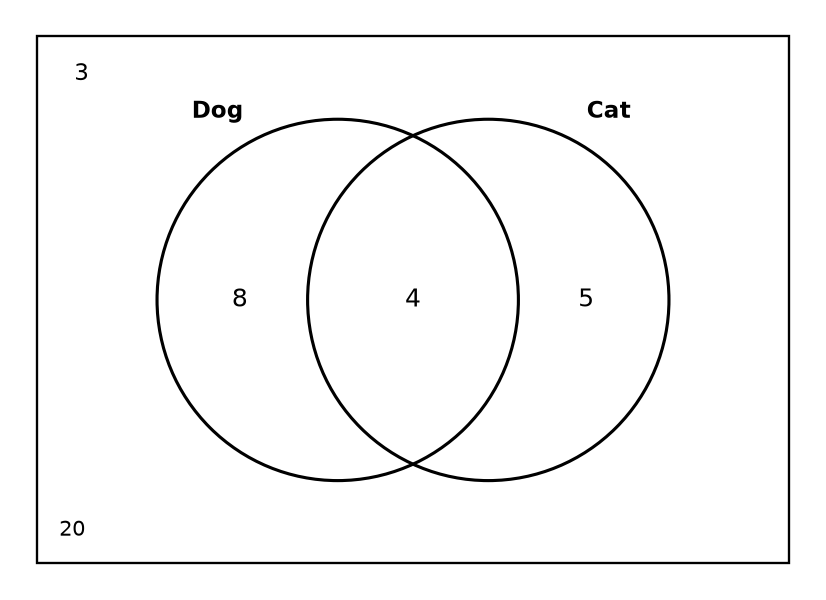
A class survey asked 20 students: "Do you have a dog?" and "Do you have a cat?" The Venn diagram shows the results.
- Only a dog: 8
- Only a cat: 5
- Both a dog and a cat: 4
- Neither: 3
- Only a dog: 8
- Only a cat: 5
- Both a dog and a cat: 4
- Neither: 3
a
State the total number of students who have a dog. [1]
b
Identify which group is the largest — only a dog, only a cat, or both — and describe what this tells us about pet ownership in this class. [2]
c
A student says: "This survey proves that most students in our school own a dog." Give two reasons why this conclusion is not reliable. [3]
Solutions
3QuestionCalculating Basic Probabilities Using Tree DiagramsConcept Practice
3 marks~5 minCriterion B
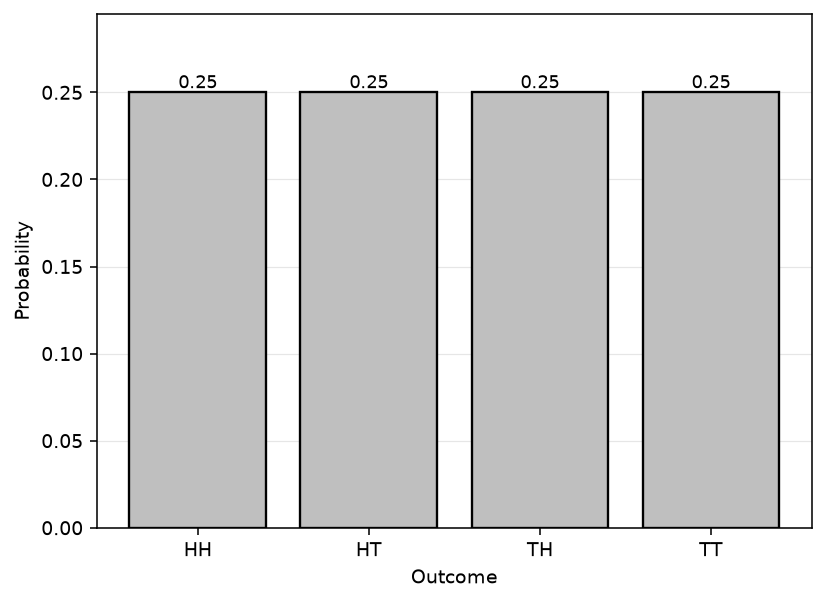
A fair coin is flipped twice. The tree diagram shows four outcomes: HH, HT, TH, and TT. Each outcome has a probability of .
a
Calculate the sum of the four probabilities. [1]
b
Describe what this sum tells you about the four outcomes. [1]
c
Describe how this rule about probabilities summing to applies to any probability situation, not just coin flipping. [1]
Solutions
4QuestionCalculating Basic Probabilities Using Tree DiagramsConcept Practice
4 marks~6 minCriterion A
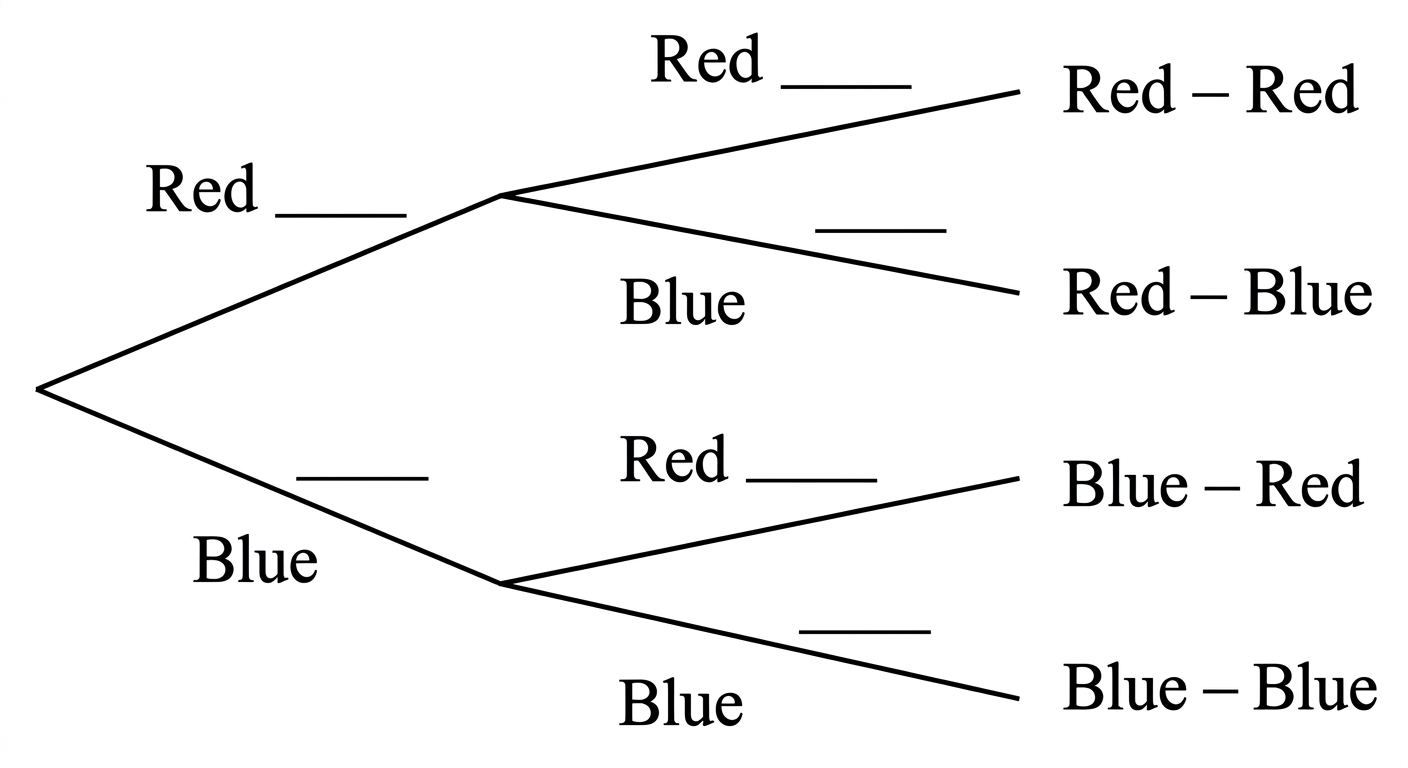
A bag contains 3 red marbles and 2 blue marbles. You pick one marble, note its colour, put it back, then pick again.
a
State the probability of picking a red marble and the probability of picking a blue marble. [1]
b
Label the tree diagram below to show all possible outcomes and their probabilities for both picks. [2]
c
Calculate the probability of picking a red marble first and a blue marble second. [1]
Solutions
That's every free question here — 4 of 16.
+12 more questions, plus Mock Papers & Worksheets, are waiting in Premium.