You're viewing free preview questions — 4 questions previewing here — subscribe to unlock 36 more, plus the Full Question Bank, Mock Papers & Worksheets.Upgrade
Box Plots and Interquartile Range — Free MYP1 Mathematics Practice Questions

1QuestionDrawing Box Plots from Data SetsConcept Practice
2 marks~3 minCriterion A
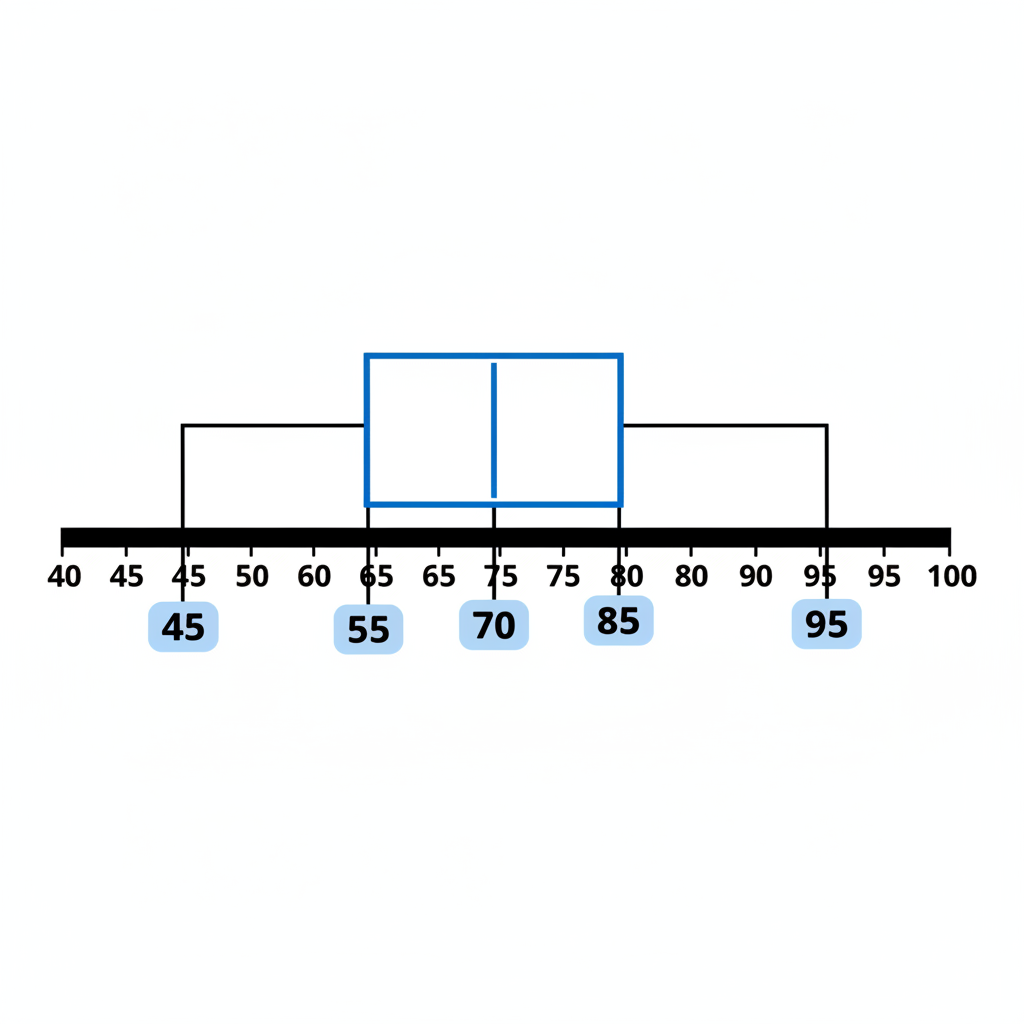
The box plot below shows the test scores of a class.
Identify the median score shown on the box plot. [1]
Describe what the median tells you about the class's test scores. [1]
Identify the median score shown on the box plot. [1]
Describe what the median tells you about the class's test scores. [1]

Solutions
2QuestionComparing Data Sets Using Box PlotsConcept Practice
2 marks~3 minCriterion C
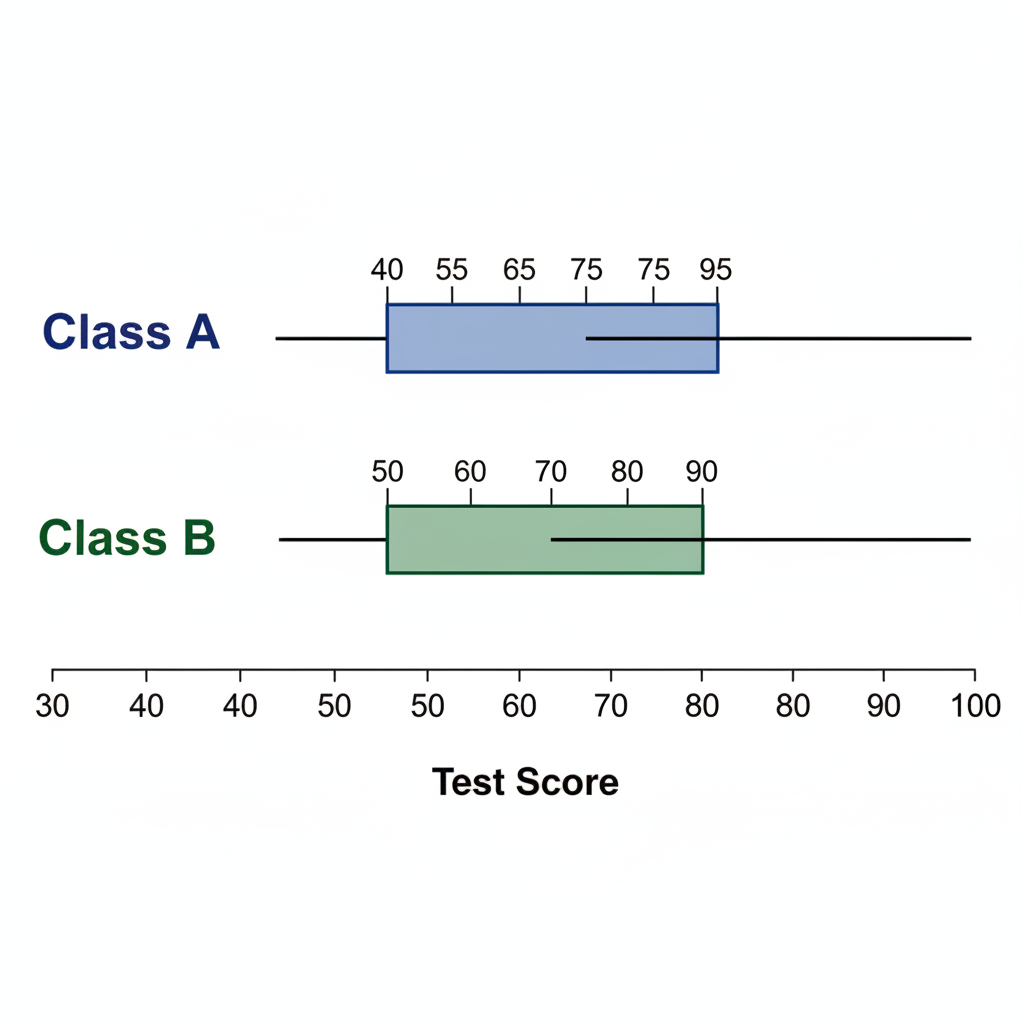
Two Year 7 classes took the same test. Their results are shown in the box plots below.
| Class A | minimum 40 | = 55 | median = 65 | = 75 | maximum 95 |
|---|---|---|---|---|---|
| Class B | minimum 50 | = 60 | median = 70 | = 80 | maximum 90 |
a
Identify one way a teacher could use these box plots to compare the two classes. [1]
b
Describe one thing the box plots do not tell the teacher about the students' scores. [1]
Solutions
3QuestionComparing Data Sets Using Box PlotsConcept Practice
2 marks~3 minCriterion A
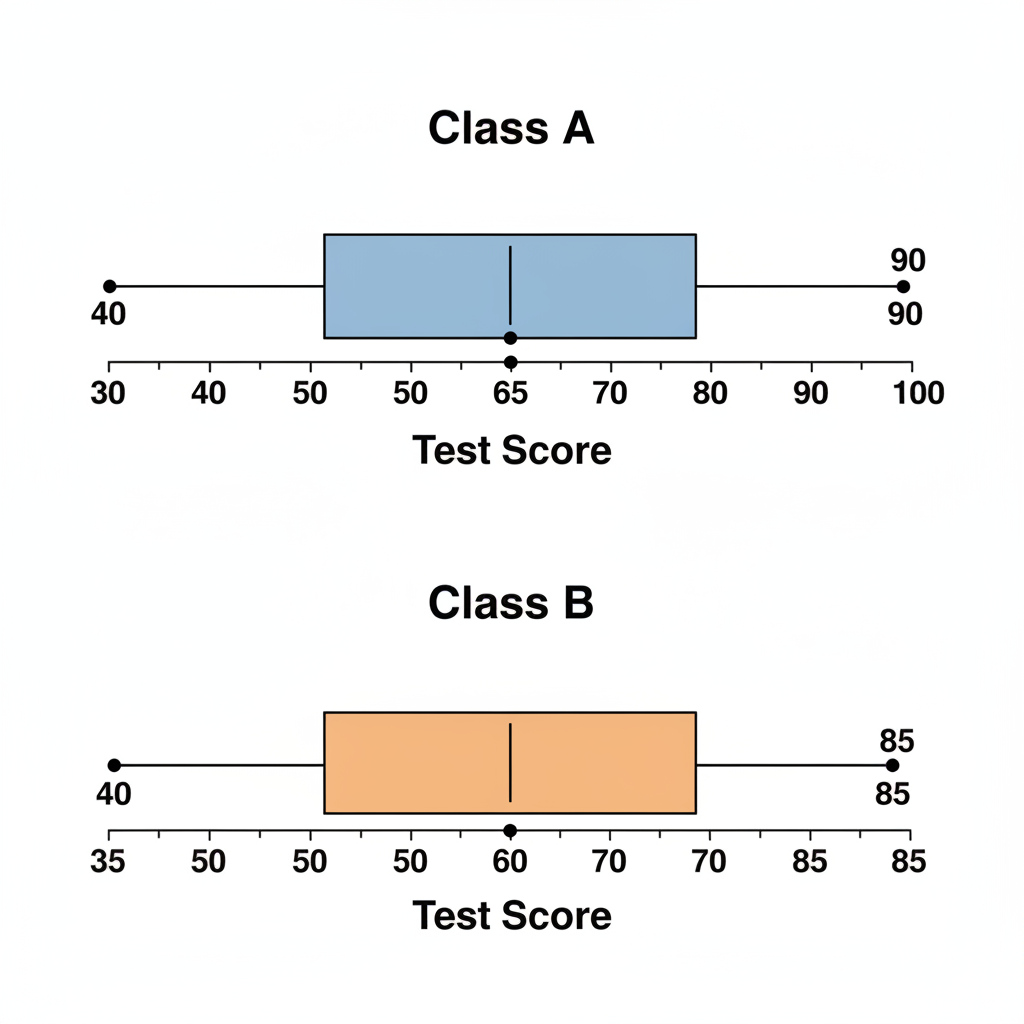
The box plots below show the test scores for Class A and Class B.
| Class A | minimum 40 | lower quartile 55 | median 65 | upper quartile 75 | maximum 90 |
|---|---|---|---|---|---|
| Class B | minimum 35 | lower quartile 50 | median 60 | upper quartile 70 | maximum 85 |
a
State the median score for each class. [1]
b
Identify which class has the higher median score and give its value. [1]
Solutions
4QuestionCalculating and Interpreting the Interquartile RangeConcept Practice
2 marks~3 minCriterion B
Here are two sets of numbers:
| Set A | 2 | 4 | 6 | 8 | 10 |
|---|---|---|---|---|---|
| Set B | 2 | 4 | 6 | 8 | 16 |
a
Calculate the interquartile range (IQR) for Set B. [1]
b
Describe what happens to the IQR when the largest value increases. [1]
Solutions
That's every free question here — 4 of 40.
+36 more questions, plus Mock Papers & Worksheets, are waiting in Premium.