You're viewing free preview questions — 4 questions previewing here — subscribe to unlock 55 more, plus the Full Question Bank, Mock Papers & Worksheets.Upgrade
Stem-and-Leaf Diagrams and Dot Plots — Free MYP2 Mathematics Practice Questions

1QuestionComparing Data Sets Using Dot PlotsConcept Practice
2 marks~3 minCriterion A
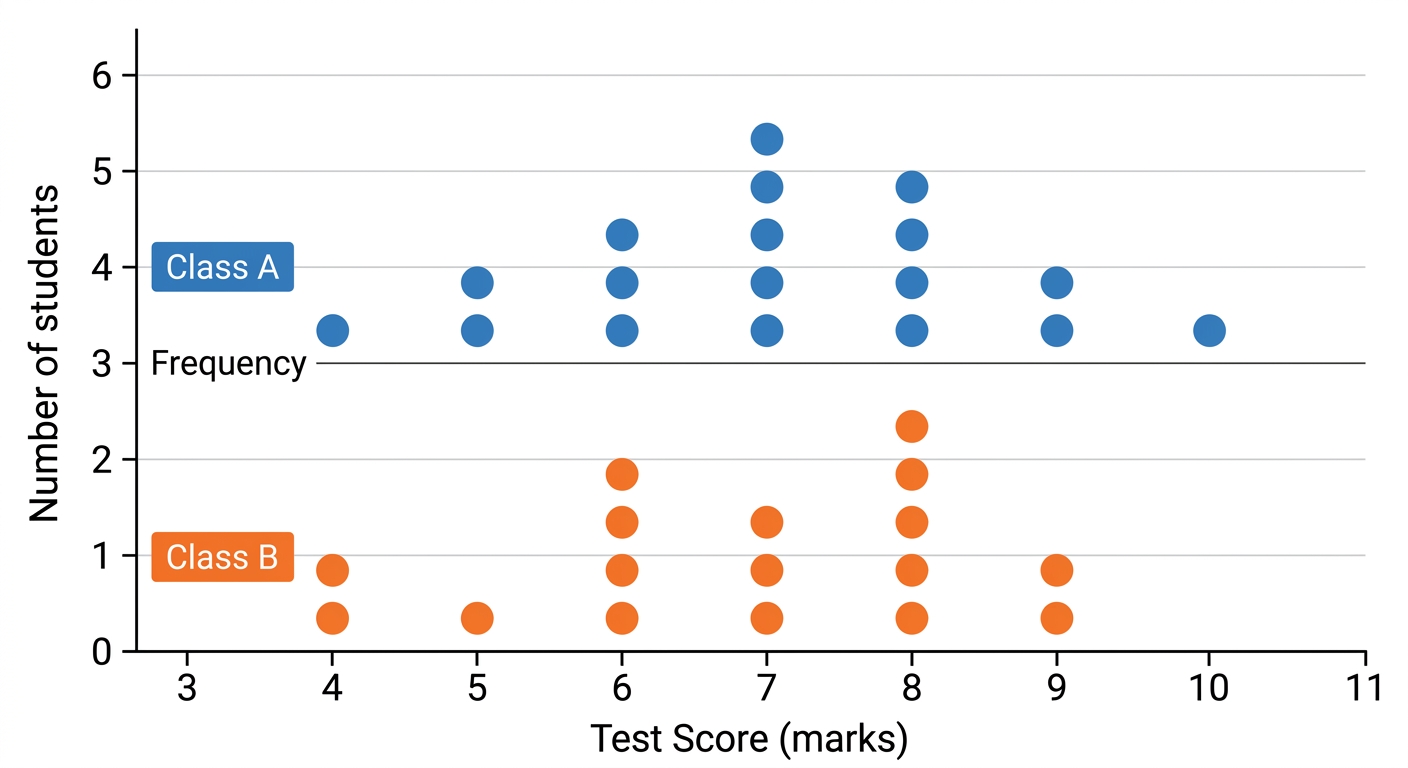
The dot plot below shows the test scores for Class A and Class B.
Class A — Score (marks): — Number of students:
Class B — Score (marks): — Number of students:
Class A — Score (marks): — Number of students:
Class B — Score (marks): — Number of students:
a
State the number of students in Class A who scored exactly marks. [1]
b
Compare the most common score (the mode) for Class A with the most common score for Class B. [1]

Solutions
2QuestionComparing Data Sets Using Dot PlotsAssessment Practice
2 marks~3 minCriterion D
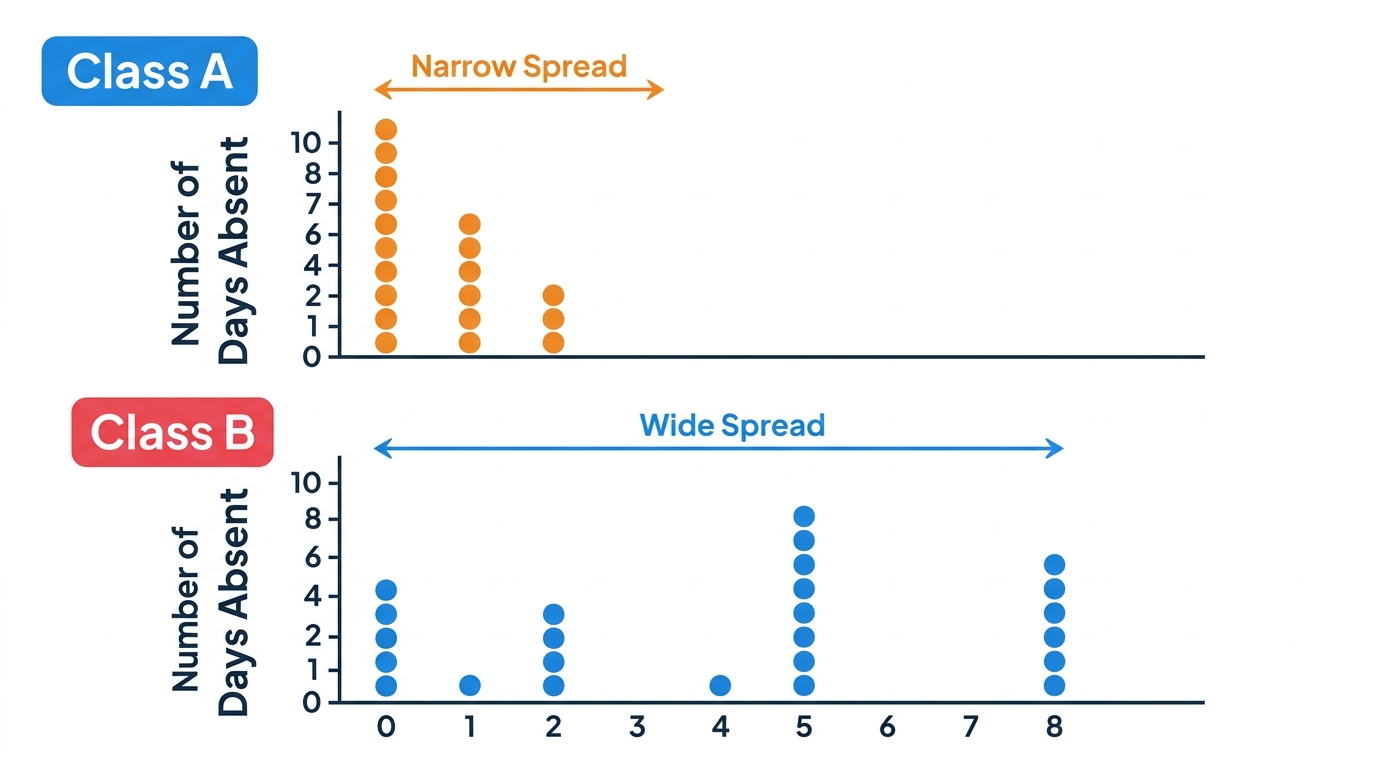
A school nurse records student absences for two classes. Class A has a narrow spread (0–2 days absent); Class B has a wider spread (0–8 days absent). Both classes have a similar average number of absences.
Explain why the school should compare the spread of absences, not just the average, when deciding whether to introduce a health campaign. [2]
Explain why the school should compare the spread of absences, not just the average, when deciding whether to introduce a health campaign. [2]
Solutions
3QuestionComparing Data Sets Using Dot PlotsAssessment Practice
3 marks~5 minCriterion C
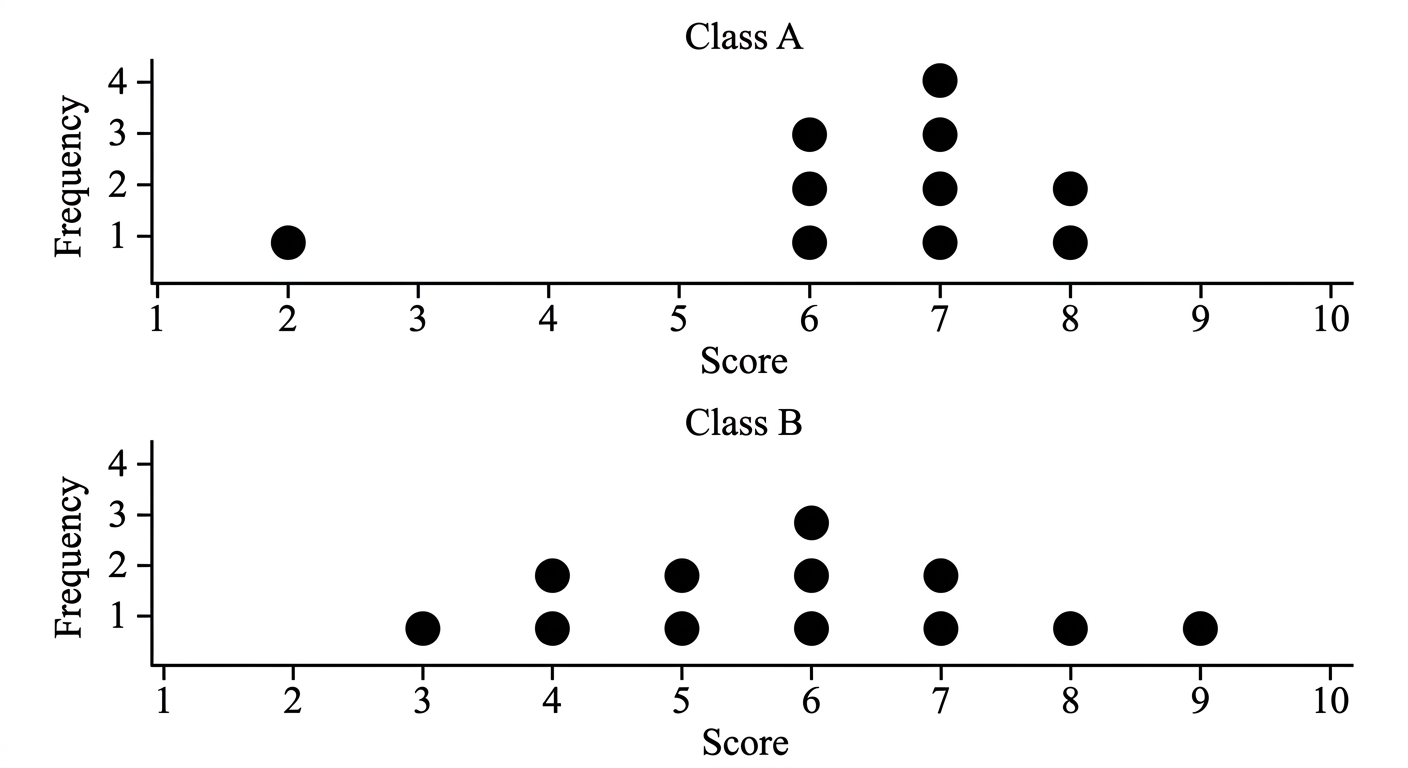
The dot plots below show quiz scores (out of 10) for two MYP 2 classes.
Class A: Score 2 (1 dot), Score 6 (3 dots), Score 7 (4 dots), Score 8 (2 dots)
Class B: Score 3 (1 dot), Score 4 (2 dots), Score 5 (2 dots), Score 6 (3 dots), Score 7 (2 dots), Score 8 (1 dot), Score 9 (1 dot)
Class A: Score 2 (1 dot), Score 6 (3 dots), Score 7 (4 dots), Score 8 (2 dots)
Class B: Score 3 (1 dot), Score 4 (2 dots), Score 5 (2 dots), Score 6 (3 dots), Score 7 (2 dots), Score 8 (1 dot), Score 9 (1 dot)
a
Identify which class has the greater range of scores. [1]
b
Describe the clustering (grouping) of scores in Class A and explain what this tells you about that class's performance. [1]
c
A new Class C is expected to follow the same pattern as Class A. Compare where most scores in Class C would fall with where most scores in Class B fall, and justify your answer. [1]
Solutions
4QuestionPlotting Dot Plots from Small Data SetsAssessment Practice
6 marks~9 minCriterion B
The table below shows the number of books read by students in one month.
| Set A | 3 | 4 | 4 | 5 | 5 | 5 | 6 | 6 | 7 |
|---|---|---|---|---|---|---|---|---|---|
| Set B | 1 | 2 | 3 | 3 | 4 | 4 | 4 | 5 | 6 |
| Set C | 2 | 2 | 3 | 3 | 3 | 4 | 4 | 5 | 8 |
| Set D | 1 | 1 | 2 | 2 | 2 | 3 | 3 | 4 | 5 |
a
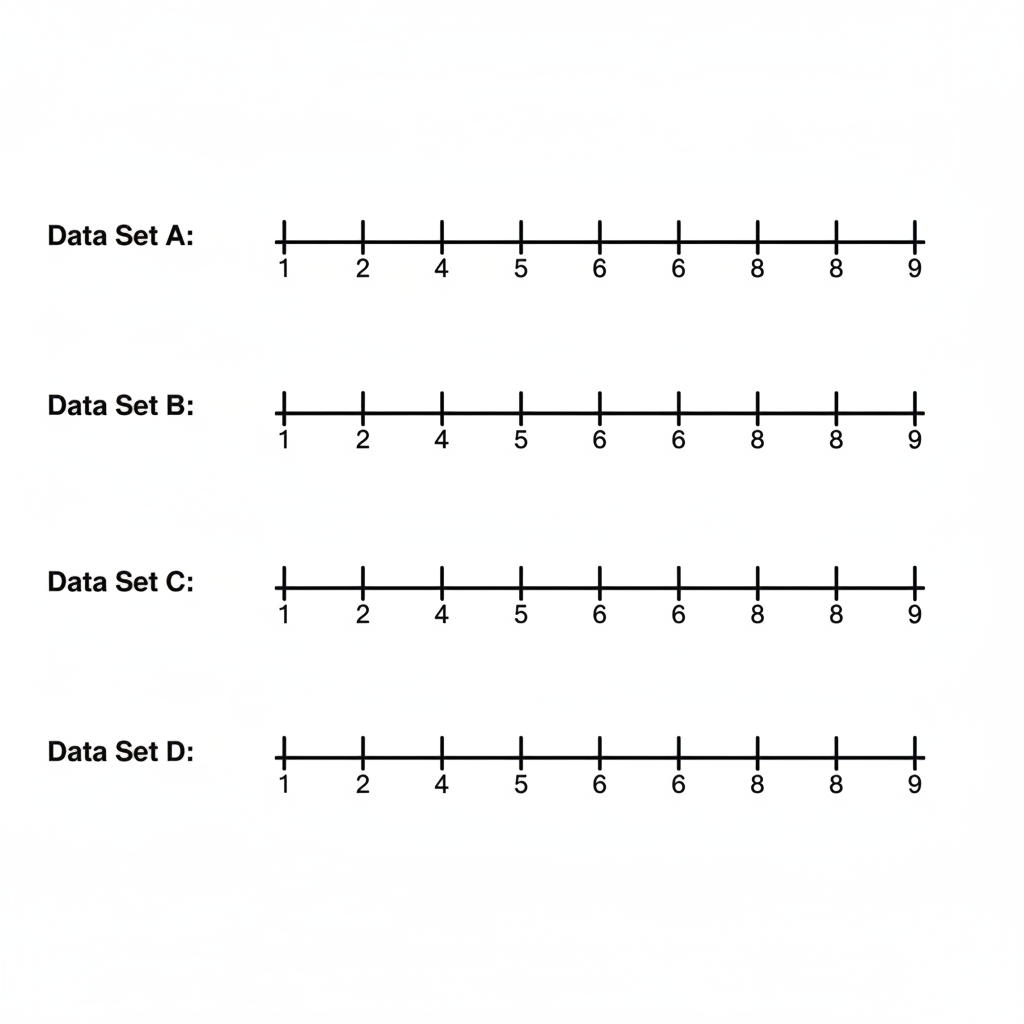
Plot a dot plot for Set A and Set D on a number line from 1 to 9. [2]
b
Describe how the spread and clustering of dots differ between Set A and Set D. [2]
c
Compare all four dot plots. Explain how the position of the mode affects whether a dot plot is symmetric (balanced on both sides) or skewed (a longer tail on one side). Use at least two data sets as examples. [2]
Solutions
That's every free question here — 4 of 59.
+55 more questions, plus Mock Papers & Worksheets, are waiting in Premium.