You're viewing free preview questions — 4 questions previewing here — subscribe to unlock 64 more, plus the Full Question Bank, Mock Papers & Worksheets.Upgrade
Box Plots and Interquartile Range — Free MYP2 Mathematics Practice Questions

1QuestionComparing Data Sets Using Box PlotsConcept Practice
2 marks~3 minCriterion B
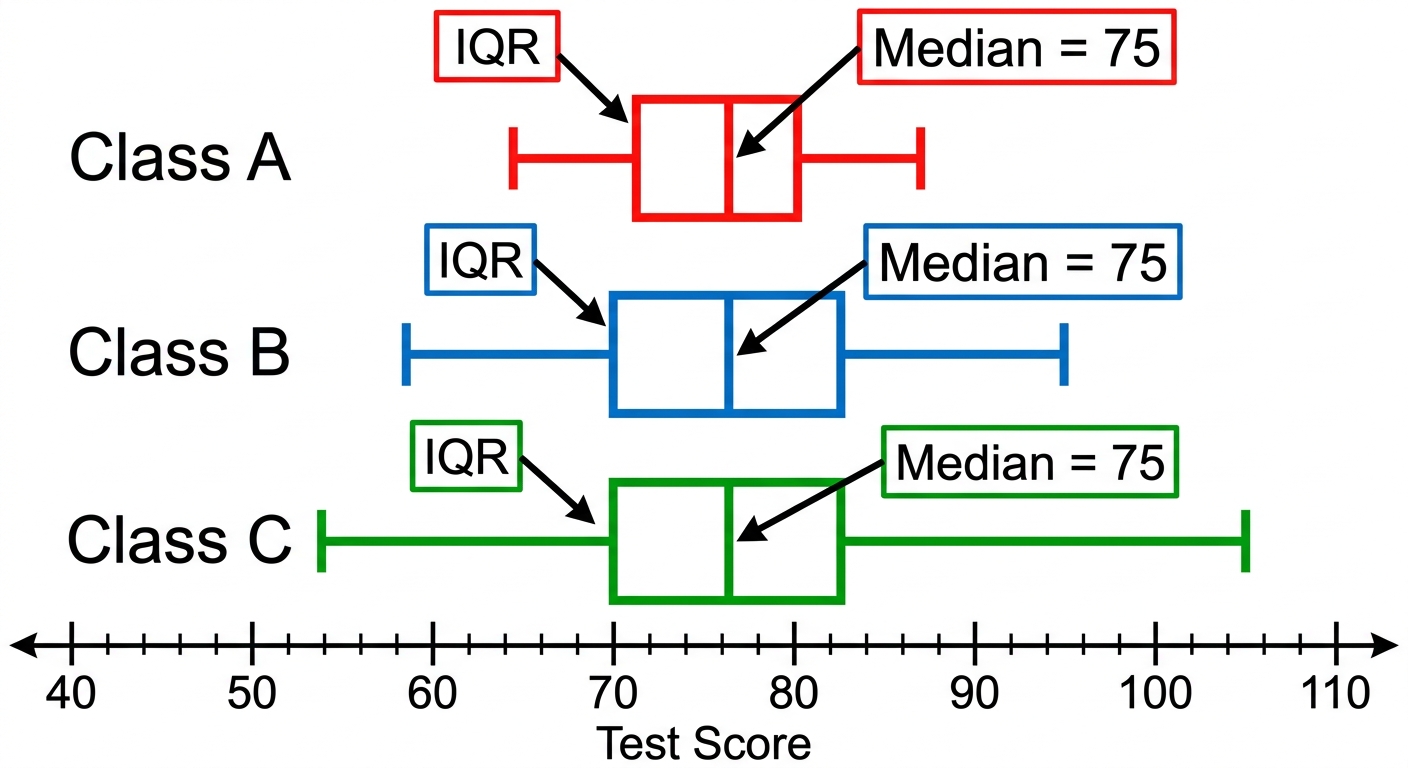
Three box plots show test scores for Class A, Class B, and Class C. All three classes have a median of .
Class A: — Class B: — Class C:
Class A: — Class B: — Class C:
a
Identify which class has the most spread in the middle 50% of scores. [1]
b
Describe the relationship between the IQR and how clustered the middle 50% of scores are, using all three classes as evidence. [1]

Solutions
2QuestionFinding the Five-Number SummaryAssessment Practice
5 marks~8 minCriterion C
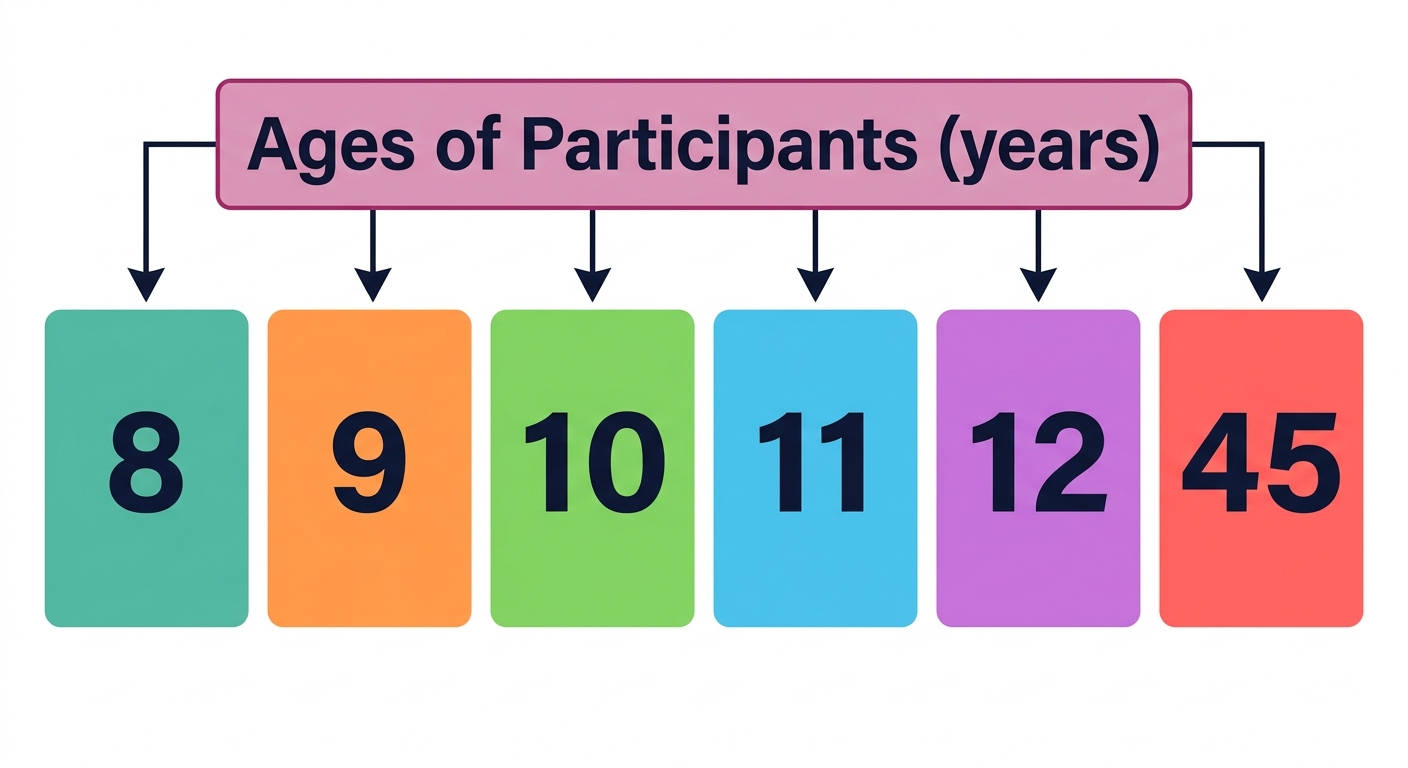
A student records the ages (in years) of six participants at a community sports event:
a
State the five-number summary (minimum, , median, , maximum) for this data set. [2]
b
Calculate the interquartile range (IQR), where . [1]
c
Compare how well the median and IQR represent the typical age of participants, and identify one limitation of the five-number summary for this data set. [2]
Solutions
3QuestionCalculating and Interpreting the Interquartile RangeConcept Practice
3 marks~5 minCriterion A
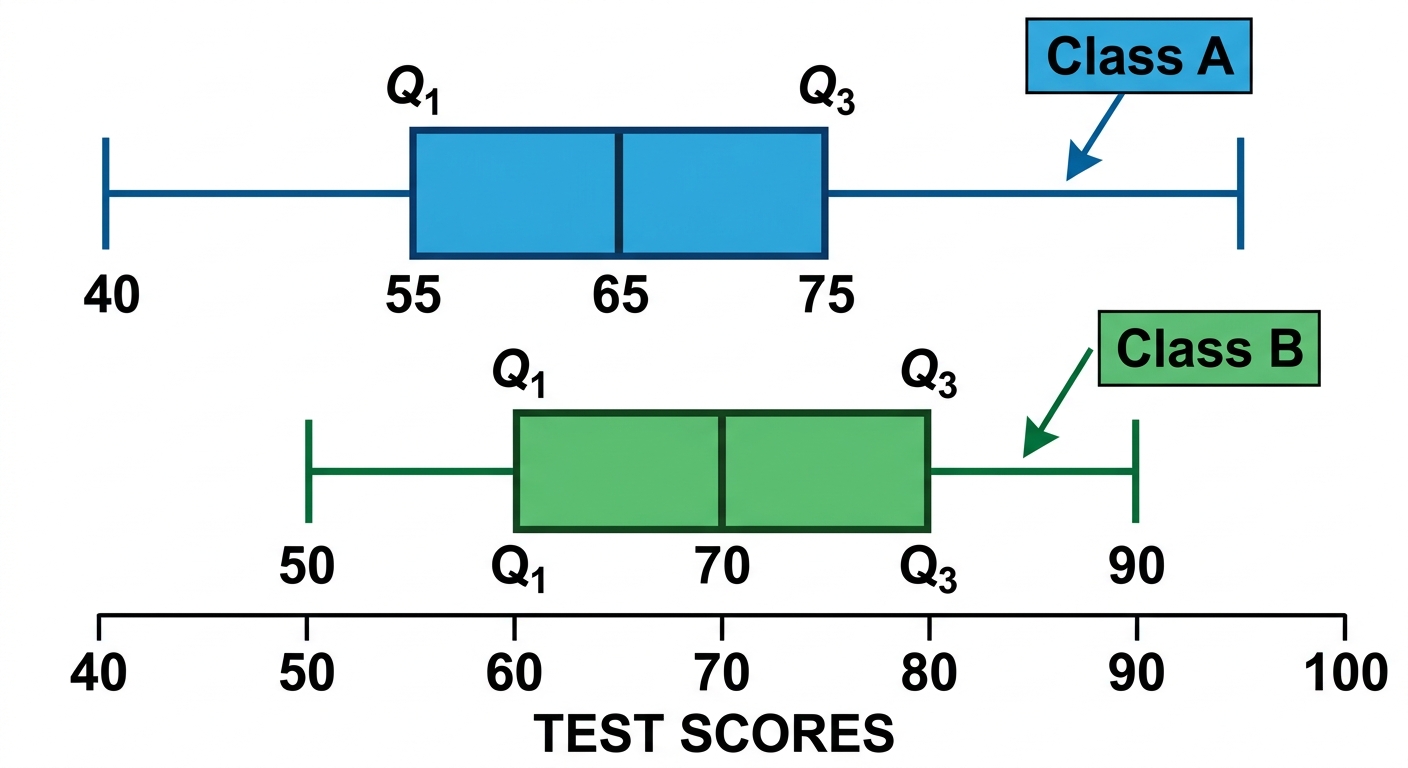
The box plots below show the test scores of Class A and Class B.
The interquartile range (IQR) measures the spread of the middle 50% of scores:
| Class A | ||
|---|---|---|
| Class B |
The interquartile range (IQR) measures the spread of the middle 50% of scores:
a
State the and values for Class B. [1]
b
Calculate the IQR for each class. [1]
c
Compare the consistency of the two classes. Refer to your IQR values in your answer. [1]
Solutions
4QuestionCalculating and Interpreting the Interquartile RangeAssessment Practice
6 marks~9 minCriterion D
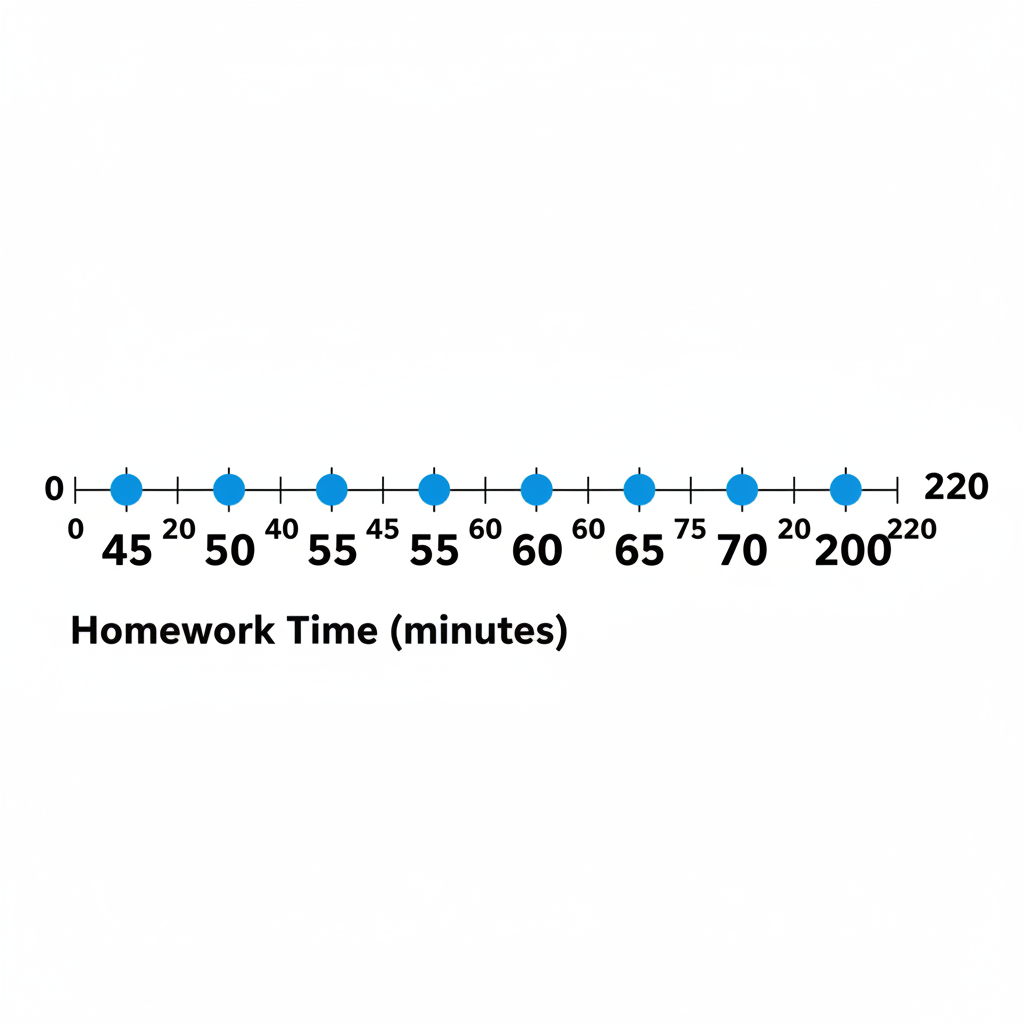
A school records the weekly homework time (in minutes) for 7 students:
a
Calculate the range and the interquartile range (IQR) for this data set. [2]
b
Identify which value is an outlier (a value far outside the rest of the data) and explain how it affects the range. [2]
c
Compare the range and the IQR as measures of spread. State which better represents the typical homework time for most students, and why. [2]
Solutions
That's every free question here — 4 of 68.
+64 more questions, plus Mock Papers & Worksheets, are waiting in Premium.