You're viewing free preview questions — 4 questions previewing here — subscribe to unlock 27 more, plus the Full Question Bank, Mock Papers & Worksheets.Upgrade
Comparing and Interpreting Averages — Free MYP2 Mathematics Practice Questions

1QuestionAnalyzing Real-Life Data with AveragesConcept Practice
2 marks~3 minCriterion A
The ages (in years) of seven students in a sports club are listed below.
Age (years): 8, 10, 9, 11, 12, 10, 9
Age (years): 8, 10, 9, 11, 12, 10, 9
a
Identify the median age of the students. [1]
b
Explain how you found the median, showing your ordered list. [1]
Solutions

2QuestionComparing Mean Median and Mode in ContextAssessment Practice
5 marks~8 minCriterion D
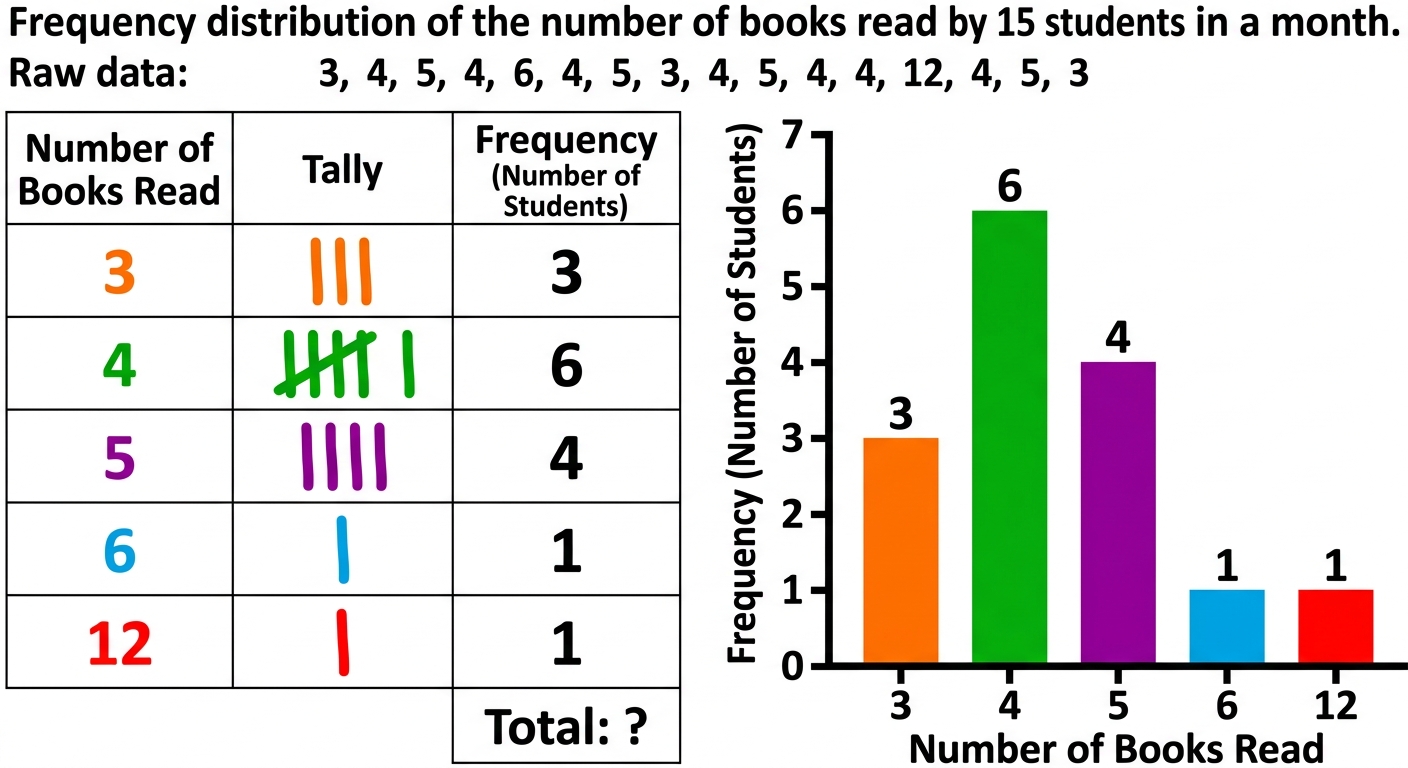
The number of books read by 15 students in one month is shown below.
| Student 1: 3 | Student 2: 4 | Student 3: 5 | Student 4: 4 | Student 5: 6 |
|---|---|---|---|---|
| Student 6: 4 | Student 7: 5 | Student 8: 3 | Student 9: 4 | Student 10: 5 |
| Student 11: 4 | Student 12: 12 | Student 13: 4 | Student 14: 5 | Student 15: 3 |
a
Identify the mode of the data. [1]
b
Calculate the mean number of books read. Show your working. [2]
c
The value 12 is an outlier — a value much higher than the rest. Compare the mean and the median, and explain which better represents the typical number of books read. [2]
Solutions
3QuestionComparing Mean Median and Mode in ContextAssessment Practice
8 marks~12 minCriterion C
A bakery records croissant sales (number sold) over 10 days:
12, 15, 18, 20, 22, 25, 28, 30, 35, 120
The owner wants to report a "typical daily sale" to a bank.
12, 15, 18, 20, 22, 25, 28, 30, 35, 120
The owner wants to report a "typical daily sale" to a bank.
a
Calculate the mean and median of the daily sales. [4]
b
Explain which average better represents a typical day. [2]
c
Compare what is gained and lost by choosing the median over the mean in this context. [2]
Solutions
4QuestionAnalyzing Real-Life Data with AveragesAssessment Practice
8 marks~12 minCriterion B
A city records daily temperatures (°C) during January.
Week 1 (4 days): 12, 15, 13, 14
Week 2 (8 days): 12, 15, 13, 14, 11, 16, 12, 15
Week 3 (12 days): 12, 15, 13, 14, 11, 16, 12, 15, 10, 17, 13, 14
Week 1 (4 days): 12, 15, 13, 14
Week 2 (8 days): 12, 15, 13, 14, 11, 16, 12, 15
Week 3 (12 days): 12, 15, 13, 14, 11, 16, 12, 15, 10, 17, 13, 14
a
Calculate the mean temperature for each week. [3]
b
The pattern in the weekly means suggests a value for the monthly mean. State what that value is and explain what the pattern shows. [2]
c
All 24 recorded values are listed below.
12, 15, 13, 14, 11, 16, 12, 15, 10, 17, 13, 14, 12, 15, 13, 14, 11, 16, 12, 15, 10, 17, 13, 14
Calculate the mean of these 24 values. Compare this result with your answer from part (b) and explain how a larger sample size affects the reliability of a mean. [3]
12, 15, 13, 14, 11, 16, 12, 15, 10, 17, 13, 14, 12, 15, 13, 14, 11, 16, 12, 15, 10, 17, 13, 14
Calculate the mean of these 24 values. Compare this result with your answer from part (b) and explain how a larger sample size affects the reliability of a mean. [3]
Solutions
That's every free question here — 4 of 31.
+27 more questions, plus Mock Papers & Worksheets, are waiting in Premium.