You're viewing free preview questions — 4 questions previewing here — subscribe to unlock 72 more, plus the Full Question Bank, Mock Papers & Worksheets.Upgrade
Working with Grouped Data — Free MYP2 Mathematics Practice Questions

1QuestionFinding the Modal ClassConcept Practice
2 marks~3 minCriterion A
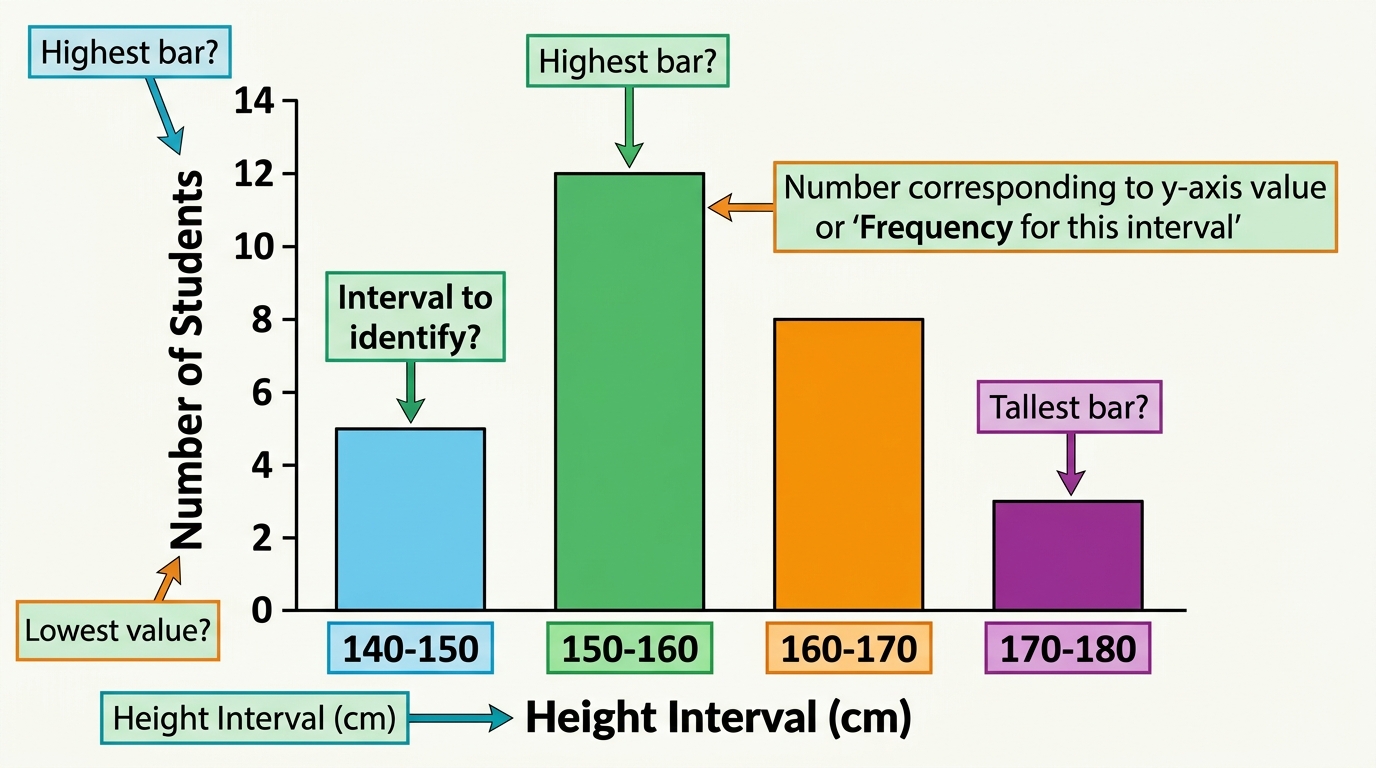
The bar chart below shows the number of students in each height interval.
| Height interval (cm) | – | – | – | – |
|---|---|---|---|---|
| Number of students |
a
Identify the modal class — the height interval with the greatest number of students. [1]
b
Explain how you know this interval is the modal class. [1]

Solutions
2QuestionFinding the Modal ClassAssessment Practice
5 marks~8 minCriterion C
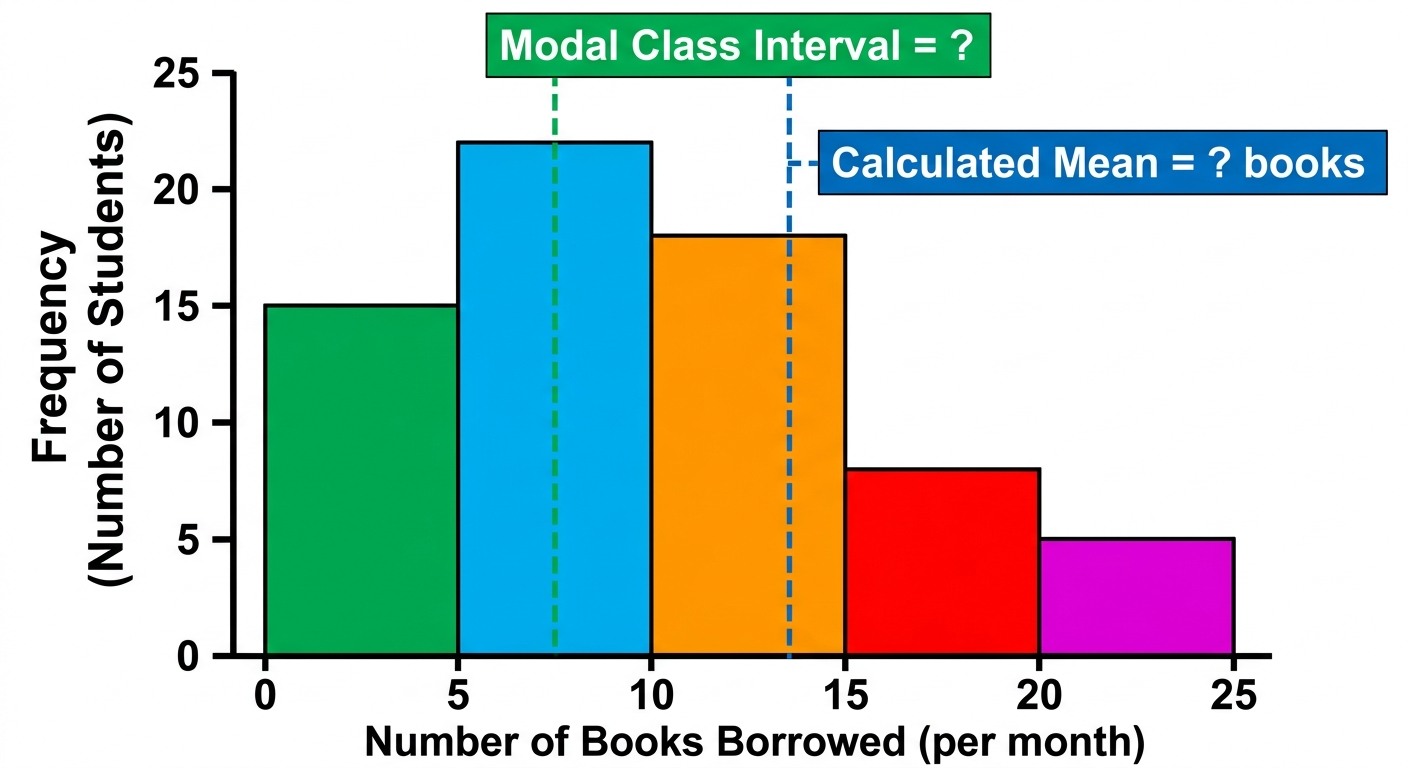
A school librarian records the number of books borrowed per student in one month.
The mean number of books borrowed is 9.6.
| Books borrowed | 0–4 | 5–9 | 10–14 | 15–19 | 20 or more |
|---|---|---|---|---|---|
| Number of students | 15 | 22 | 18 | 8 | 5 |
The mean number of books borrowed is 9.6.
a
Identify the modal class. [1]
b
Explain whether the modal class is a good measure of typical borrowing for this group. Use the mean in your answer. [2]
c
Describe one limitation of using only the modal class to summarise the borrowing data. [2]
Solutions
3QuestionCalculating Midpoints for IntervalsConcept Practice
2 marks~3 minCriterion B
A grouped frequency table shows the masses of several parcels.
| Mass (kg) | 0–10 | 10–20 | 20–30 | 30–40 |
|---|---|---|---|---|
| Midpoint (kg) | 5 | 15 | ? | ? |
a
Calculate the midpoints for the intervals 20–30 kg and 30–40 kg. [1]
Midpoint for 20–30 kg: ___
Midpoint for 30–40 kg: ___
Midpoint for 20–30 kg: ___
Midpoint for 30–40 kg: ___
b
Describe the pattern in the midpoint values across all four intervals. [1]
Solutions
4QuestionGrouping Data into Class IntervalsAssessment Practice
6 marks~9 minCriterion D
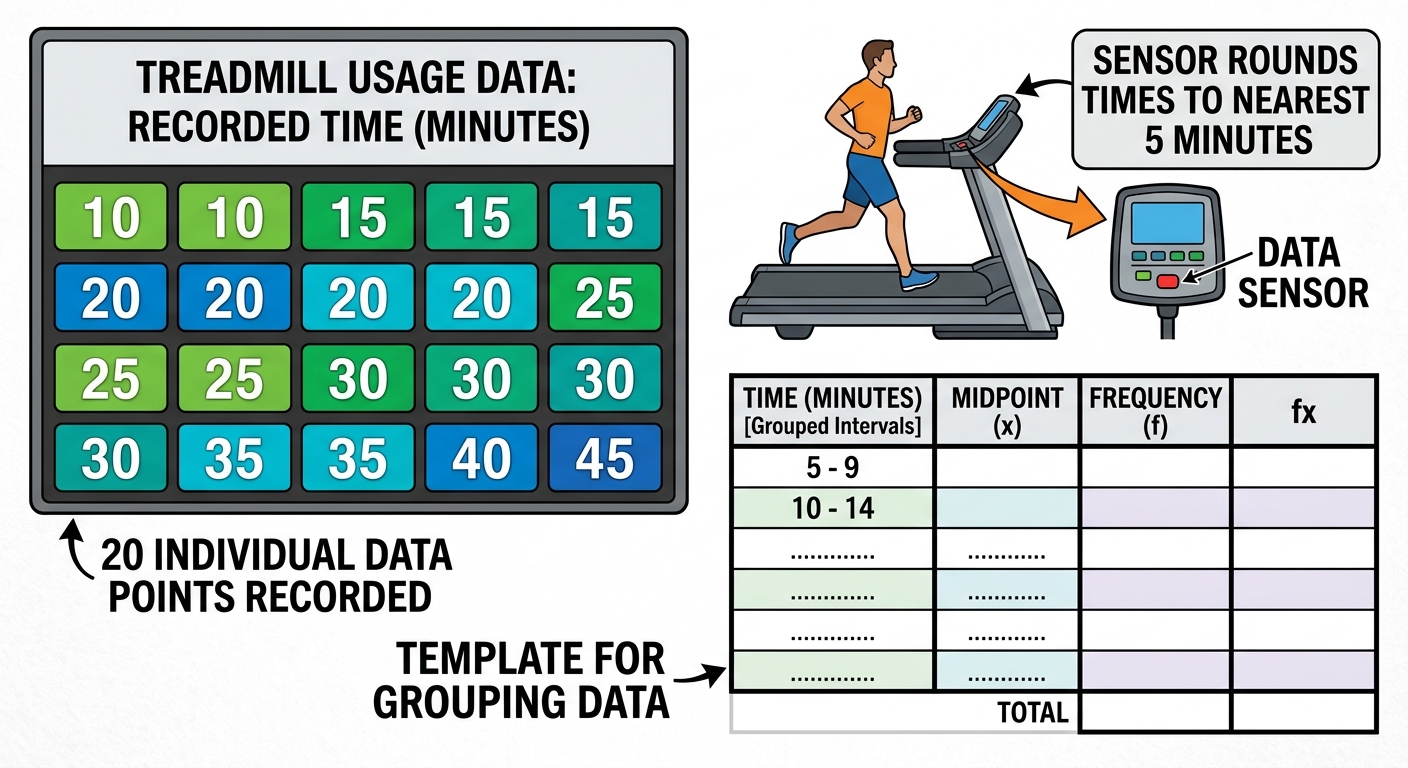
A fitness centre records how long 20 members spend on a treadmill. Each time is rounded to the nearest 5 minutes. The recorded times (in minutes) are:
10, 10, 15, 15, 15, 20, 20, 20, 20, 25, 25, 25, 30, 30, 30, 30, 35, 35, 40, 45
10, 10, 15, 15, 15, 20, 20, 20, 20, 25, 25, 25, 30, 30, 30, 30, 35, 35, 40, 45
a
Complete a frequency table using class intervals of width 10 minutes: 10–19, 20–29, 30–39, 40–49. State the frequency for each interval. [2]
b
Calculate the mean time using the midpoint of each class interval. Show your working. [2]
c
The times were rounded before grouping. Explain how this affects the accuracy of the mean you calculated, and identify one way this grouped data could mislead the fitness centre's planning. [2]
Solutions
That's every free question here — 4 of 76.
+72 more questions, plus Mock Papers & Worksheets, are waiting in Premium.