You're viewing free preview questions — 4 questions previewing here — subscribe to unlock 70 more, plus the Full Question Bank, Mock Papers & Worksheets.Upgrade
Food Chains and Webs — Free MYP2 Sciences Practice Questions

1QuestionConstructing and Interpreting Food ChainsConcept Practice
2 marks~3 minCriterion A
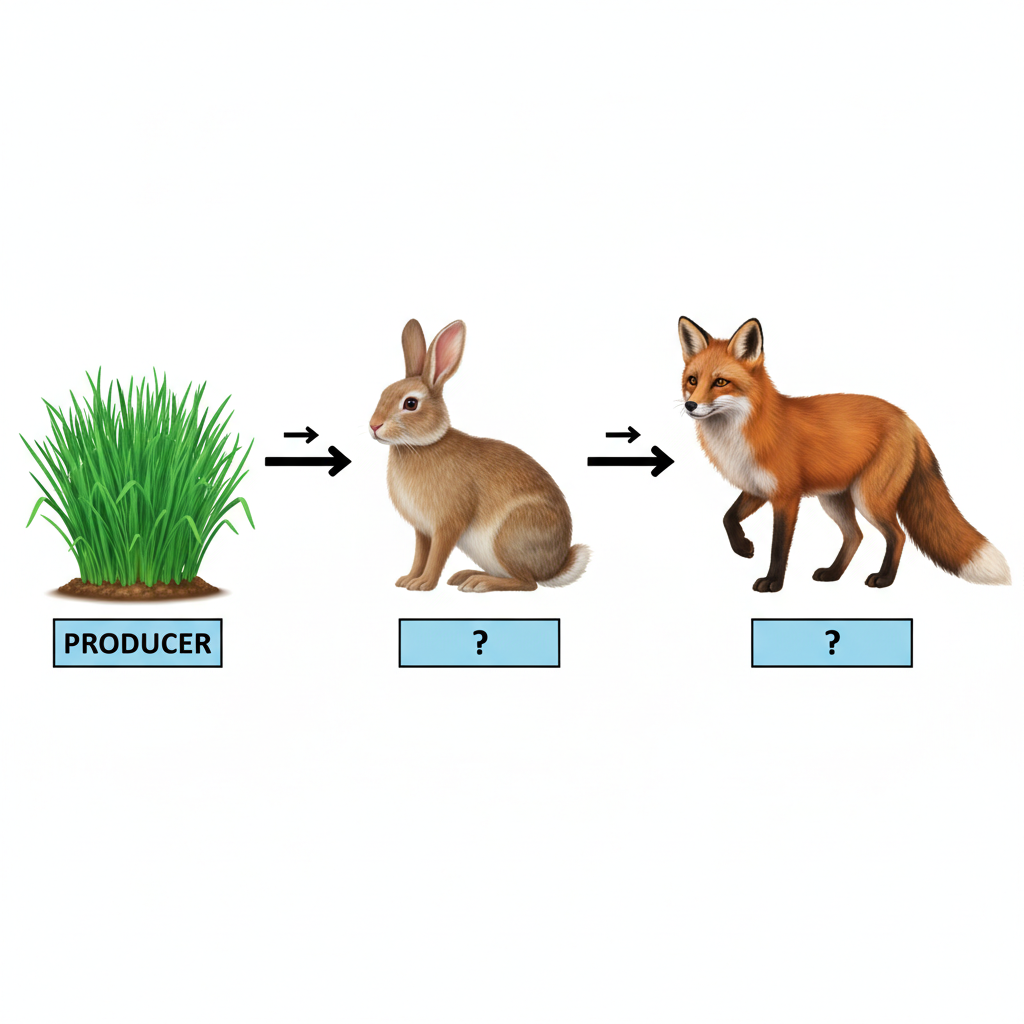
In the food chain below, grass is a producer — an organism that makes its own food.
grass → rabbit → fox
grass → rabbit → fox
a
Identify the trophic level of the rabbit. [1]
b
Explain why the rabbit occupies that trophic level. [1]

Solutions
2QuestionConstructing and Interpreting Food ChainsAssessment Practice
5 marks~8 minCriterion D
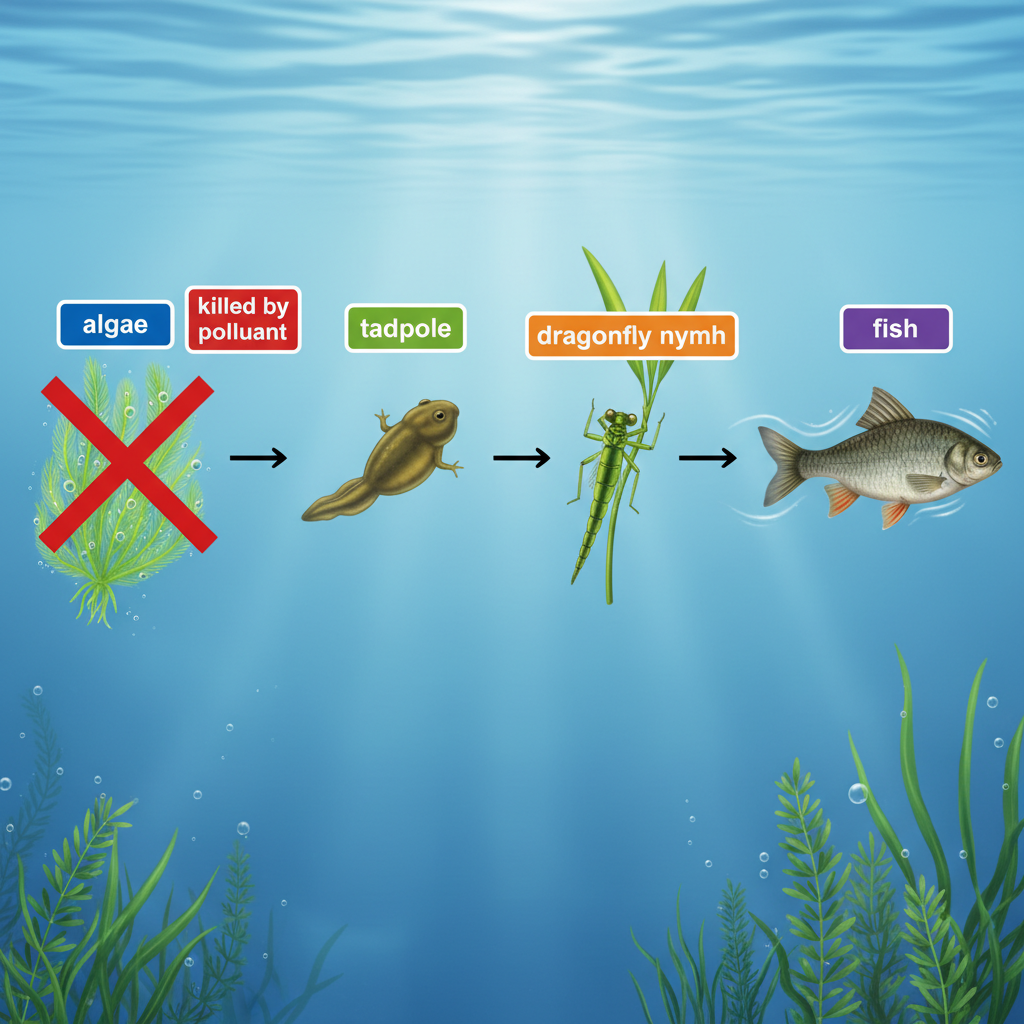
A student models a local pond using this food chain:
algae → tadpole → dragonfly nymph → fish
A pollutant then destroys all the algae in the pond.
algae → tadpole → dragonfly nymph → fish
A pollutant then destroys all the algae in the pond.
a
State what happens to the fish population in the short term. [1]
b
Explain how the loss of algae affects the tadpoles and dragonfly nymphs. [2]
c
Identify one limitation of this food chain model and explain why it makes the model less reliable for predicting what really happens in the pond. [2]
Solutions
3QuestionEnergy Flow Through Food WebsAssessment Practice
5 marks~8 minCriterion C
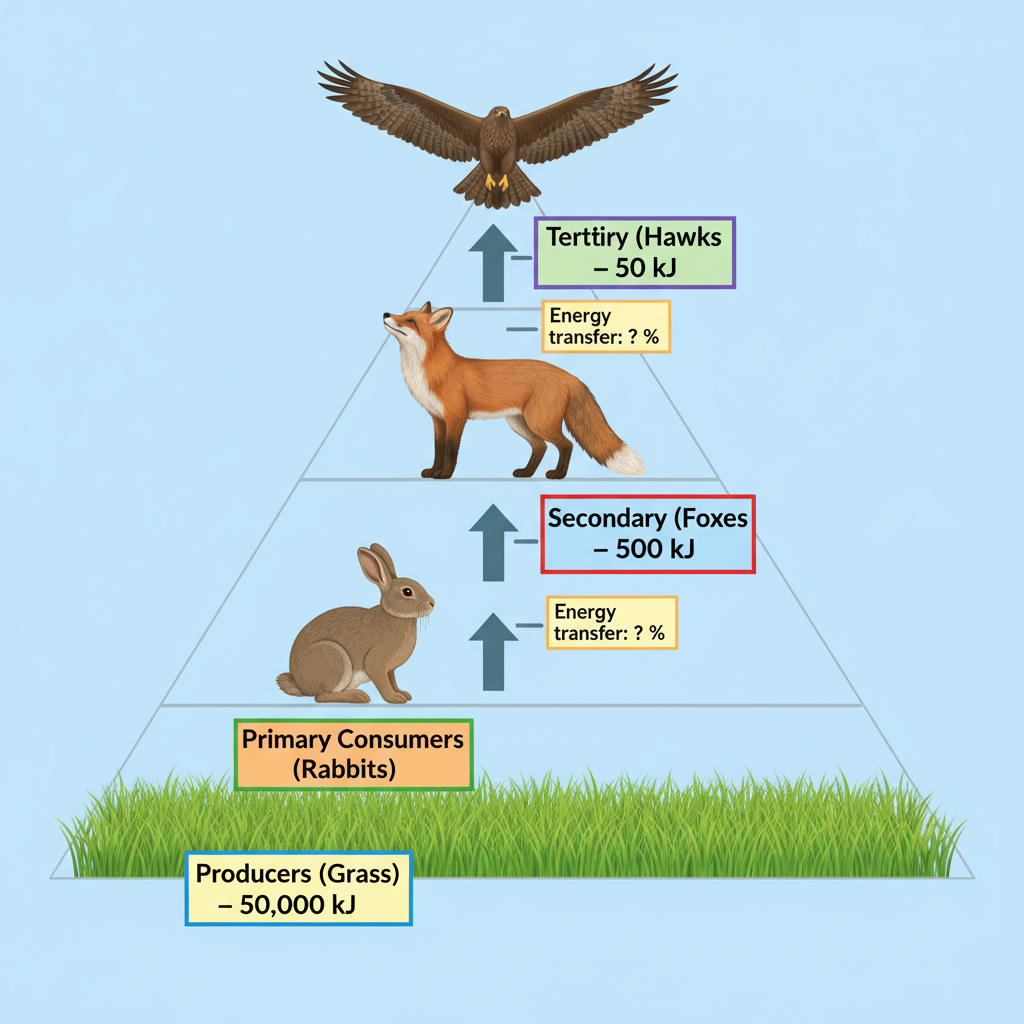
In a grassland food web, grass (the producer) contains 50 000 kJ of energy. Rabbits (primary consumers) obtain 5 000 kJ, foxes (secondary consumers) obtain 500 kJ, and hawks (tertiary consumers) obtain 50 kJ.
a
Calculate the percentage of energy transferred from grass to rabbits. Show your working. [1]
b
Calculate the percentage of energy transferred from rabbits to foxes. Show your working. [1]
c
A student claims that energy transfer becomes less efficient at each higher trophic level. Using your results from (a) and (b), and calculating the transfer from foxes to hawks, compare the efficiency of all three transfers and explain whether the student's claim is correct. [3]
Solutions
4QuestionTrophic Levels and Energy Transfer IntroductoryAssessment Practice
8 marks~12 minCriterion B
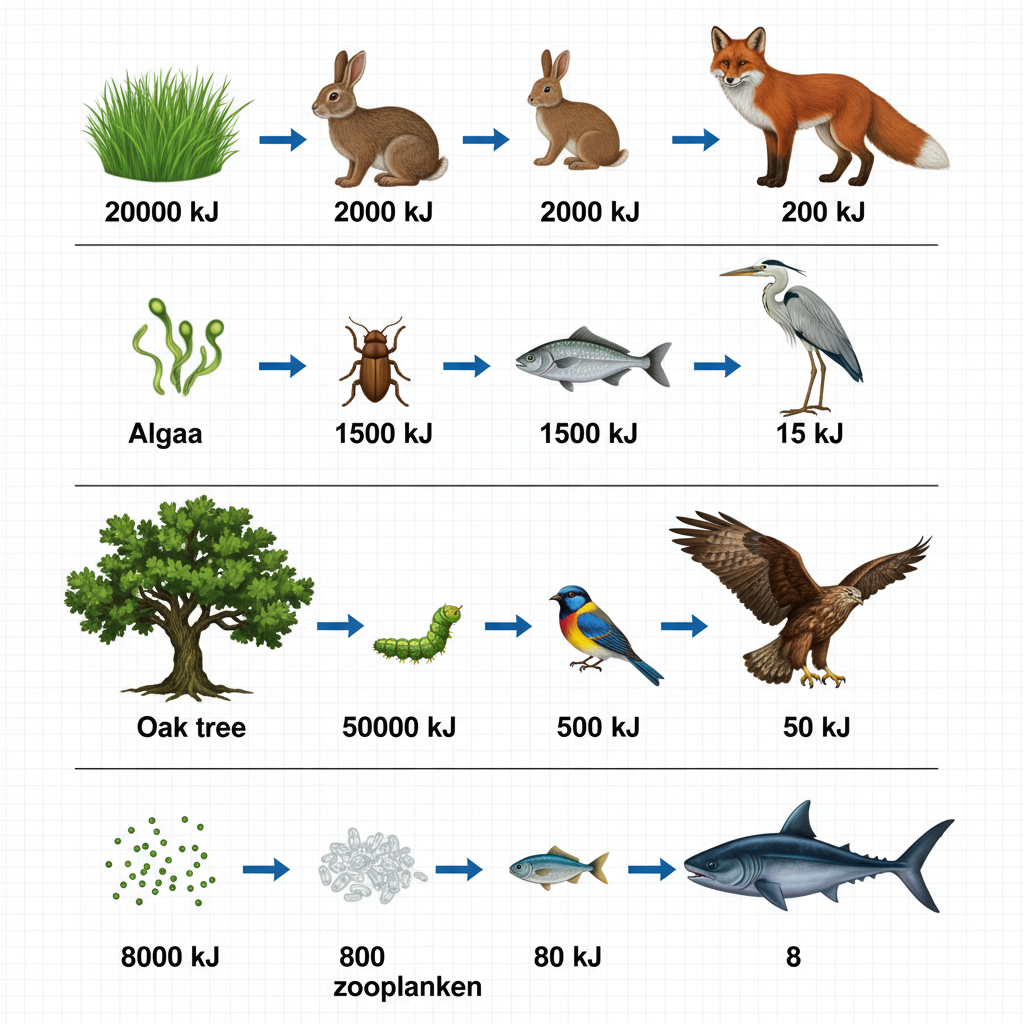
Students measured the energy (in kJ) available at each trophic level — the feeding position of an organism in a food chain — for three food chains.
Food chain 1: Grass (20 000 kJ) → Rabbit (2 000 kJ) → Fox (200 kJ)
Food chain 2: Algae (15 000 kJ) → Insect (1 500 kJ) → Fish (150 kJ) → Heron (15 kJ)
Food chain 3: Oak tree (50 000 kJ) → Caterpillar (5 000 kJ) → Bird (500 kJ) → Hawk (50 kJ)
Food chain 1: Grass (20 000 kJ) → Rabbit (2 000 kJ) → Fox (200 kJ)
Food chain 2: Algae (15 000 kJ) → Insect (1 500 kJ) → Fish (150 kJ) → Heron (15 kJ)
Food chain 3: Oak tree (50 000 kJ) → Caterpillar (5 000 kJ) → Bird (500 kJ) → Hawk (50 kJ)
a
Identify the percentage of energy transferred between each pair of trophic levels in food chains 1, 2, and 3. [2]
b
Calculate the missing energy values for the food chain below. Show your working.
Grass (25 000 kJ) → Grasshopper (? kJ) → Frog (? kJ) → Snake (? kJ) [3]
Grass (25 000 kJ) → Grasshopper (? kJ) → Frog (? kJ) → Snake (? kJ) [3]
c
Compare the energy available at the producer level with the energy available at the top predator level across all four food chains. Use this to explain why food chains rarely have more than four or five trophic levels. [3]
Solutions
That's every free question here — 4 of 74.
+70 more questions, plus Mock Papers & Worksheets, are waiting in Premium.