You're viewing free preview questions — 4 questions previewing here — subscribe to unlock 76 more, plus the Full Question Bank, Mock Papers & Worksheets.Upgrade
Pitch Loudness and Hearing — Free MYP2 Sciences Practice Questions

1QuestionHow Amplitude Affects LoudnessConcept Practice
2 marks~3 minCriterion A
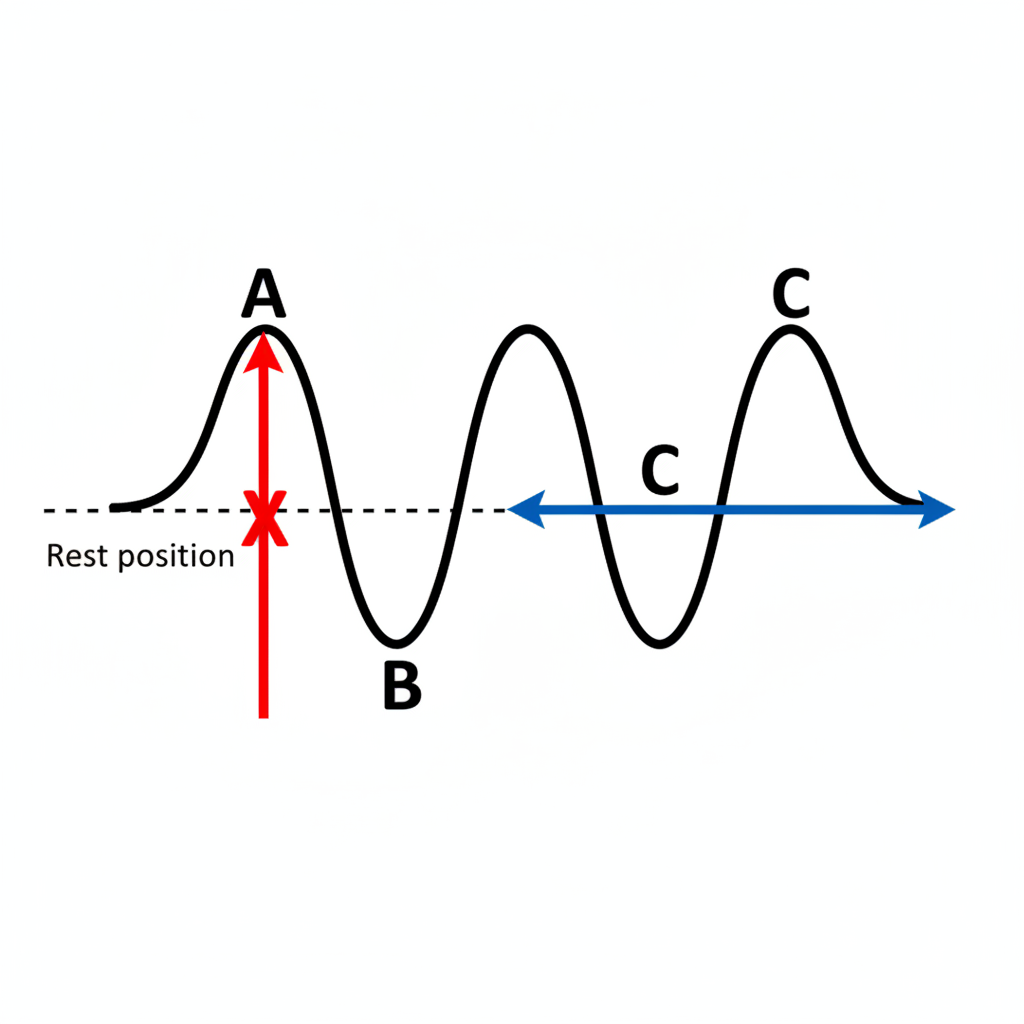
The diagram shows a transverse wave. A dashed horizontal line marks the rest position. Arrow X points vertically from the rest position to the crest of the wave.
a
Identify the physical quantity represented by arrow X. [1]
b
Describe what this quantity tells you about the wave. [1]

Solutions
2QuestionNoise vs Music Basic ConceptsAssessment Practice
5 marks~8 minCriterion C
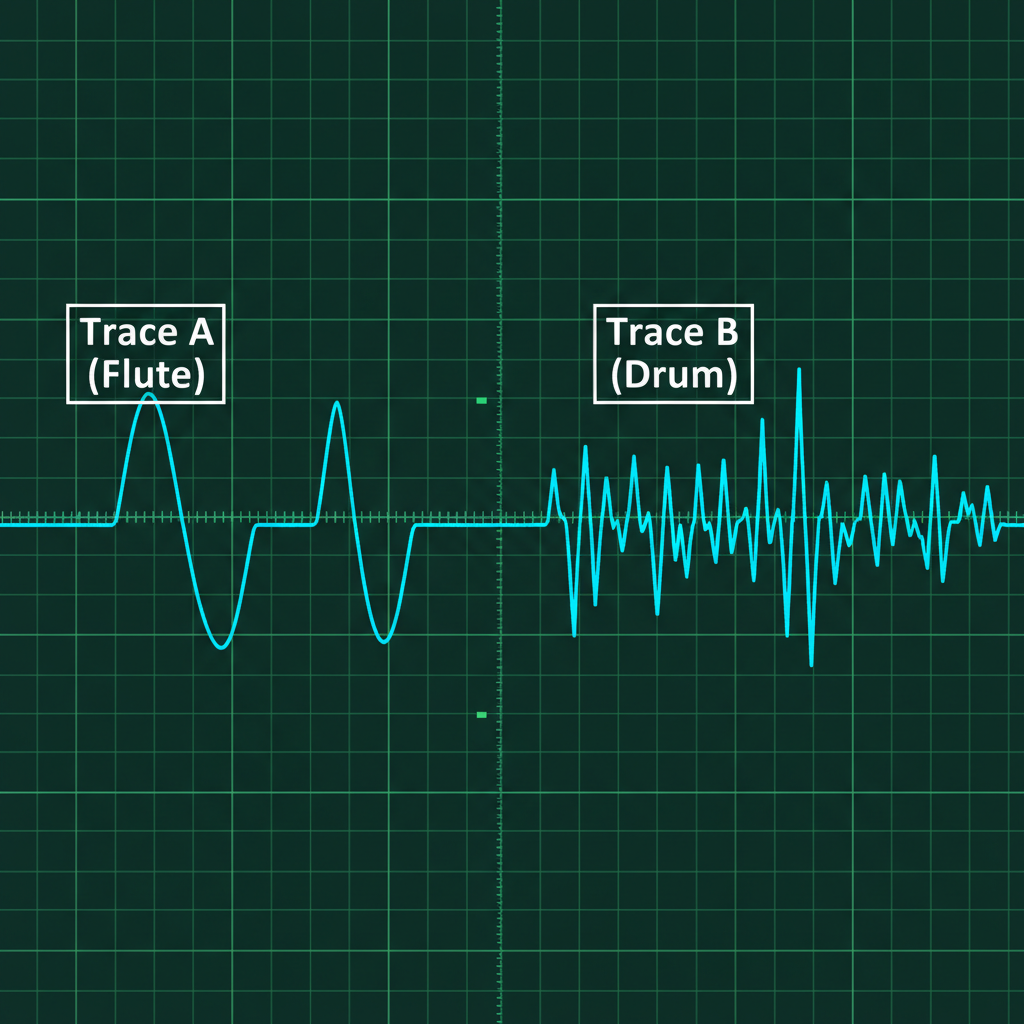
The oscilloscope traces below show sounds made by a flute (Trace A) and a drum (Trace B).
Trace A: a smooth, regularly repeating wave pattern.
Trace B: an irregular, jagged pattern with no repeating shape.
Trace A: a smooth, regularly repeating wave pattern.
Trace B: an irregular, jagged pattern with no repeating shape.
a
Identify which trace shows a musical sound and which shows noise. [1]
b
Explain what feature of the waveform tells you which is which. [2]
c
A student claims: "Any sound with an irregular waveform will damage your hearing." Compare this claim with what the traces show, and state whether you agree. [2]
Solutions
3QuestionHow Amplitude Affects LoudnessAssessment Practice
5 marks~8 minCriterion D
A school crossing uses a buzzer to warn drivers. At low amplitude (small vibrations), the sound is too quiet to hear over traffic. At high amplitude (large vibrations), the sound is audible but may cause hearing damage with repeated exposure.
a
Identify one problem caused by setting the buzzer to low amplitude. [1]
b
Explain why setting the buzzer to high amplitude also creates a problem. [2]
c
Compare the two amplitude settings and suggest which is the greater safety concern for people at the crossing. [2]

Solutions
4QuestionHow Frequency Affects PitchAssessment Practice
6 marks~9 minCriterion B
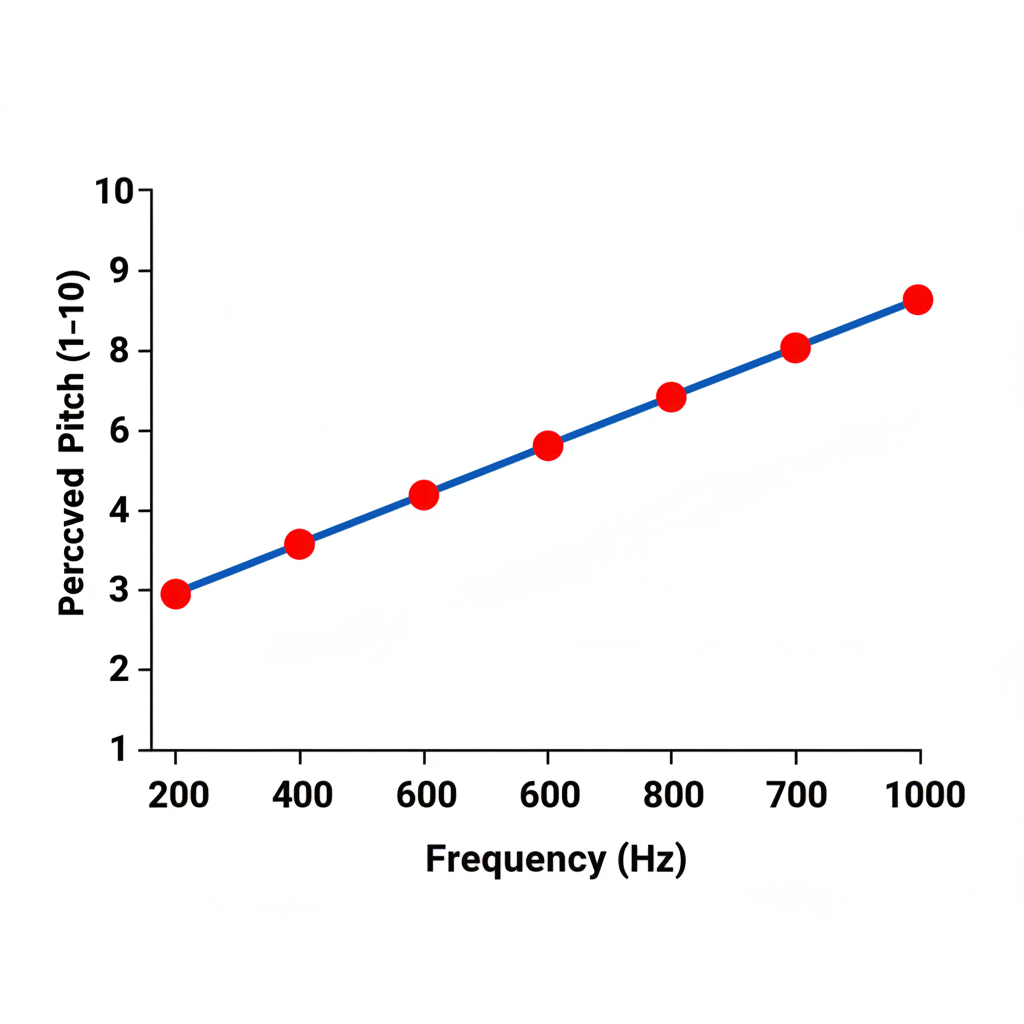
The graph below shows how frequency (in Hz) affects perceived pitch (rated 1–10) for five sound sources.
a
Identify the perceived pitch of a sound with a frequency of 500 Hz. [1]
b
Describe the relationship between frequency and perceived pitch shown by the graph. [2]
c
A student claims that a sound at 1200 Hz would have a perceived pitch of 12. State whether you agree, and explain your reasoning using the relationship from the graph. [3]
Solutions
That's every free question here — 4 of 80.
+76 more questions, plus Mock Papers & Worksheets, are waiting in Premium.