You're viewing free preview questions — 4 questions previewing here — subscribe to unlock 67 more, plus the Full Question Bank, Mock Papers & Worksheets.Upgrade
Bar Charts Line Graphs Pie Charts — Free MYP3 Mathematics Practice Questions

1QuestionConverting Frequency into Angles for Pie ChartsConcept Practice
2 marks~3 minCriterion A
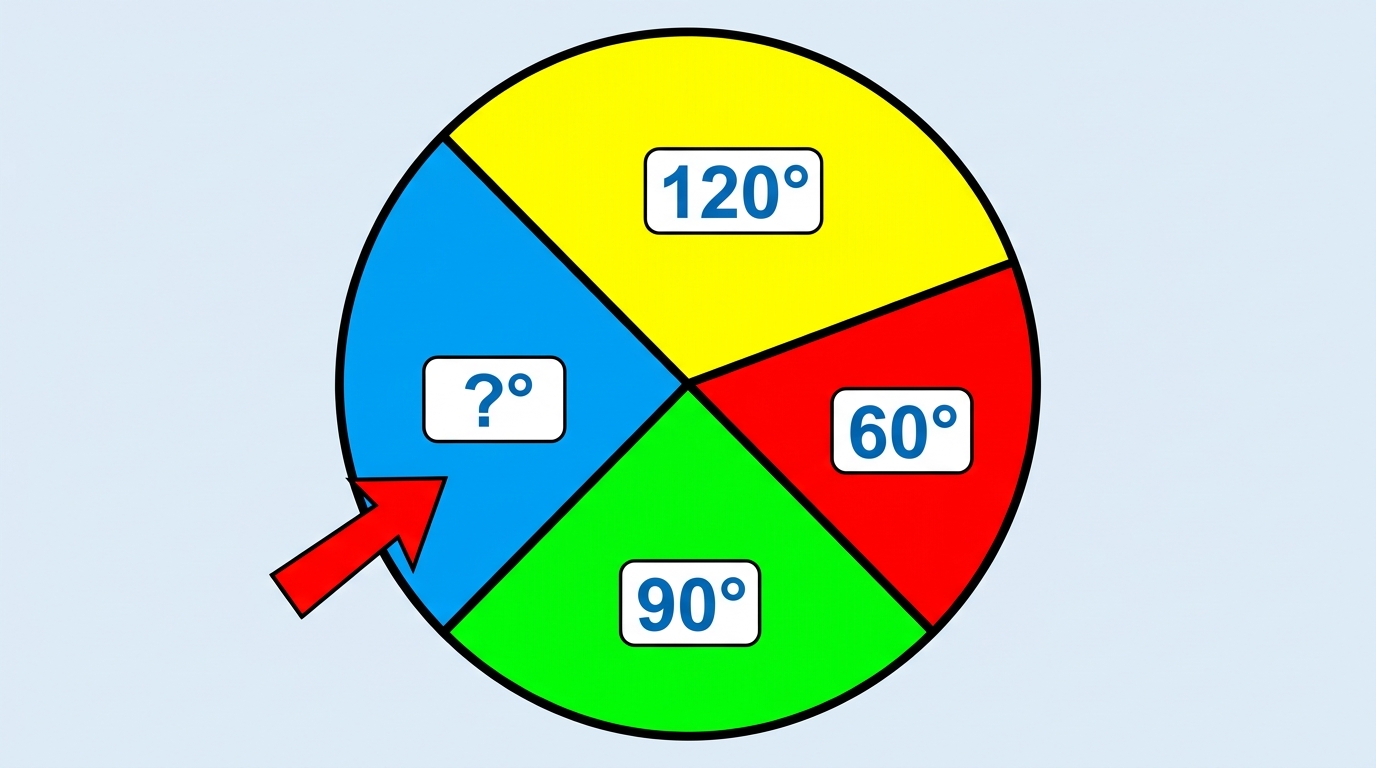
A pie chart shows four sectors. Three sectors measure , , and . The fourth sector is unlabelled.
a
State the total number of degrees in a full circle. [1]
b
Calculate the angle of the missing sector. [1]

Solutions
2QuestionChoosing the Right Graph for the DataAssessment Practice
4 marks~6 minCriterion C
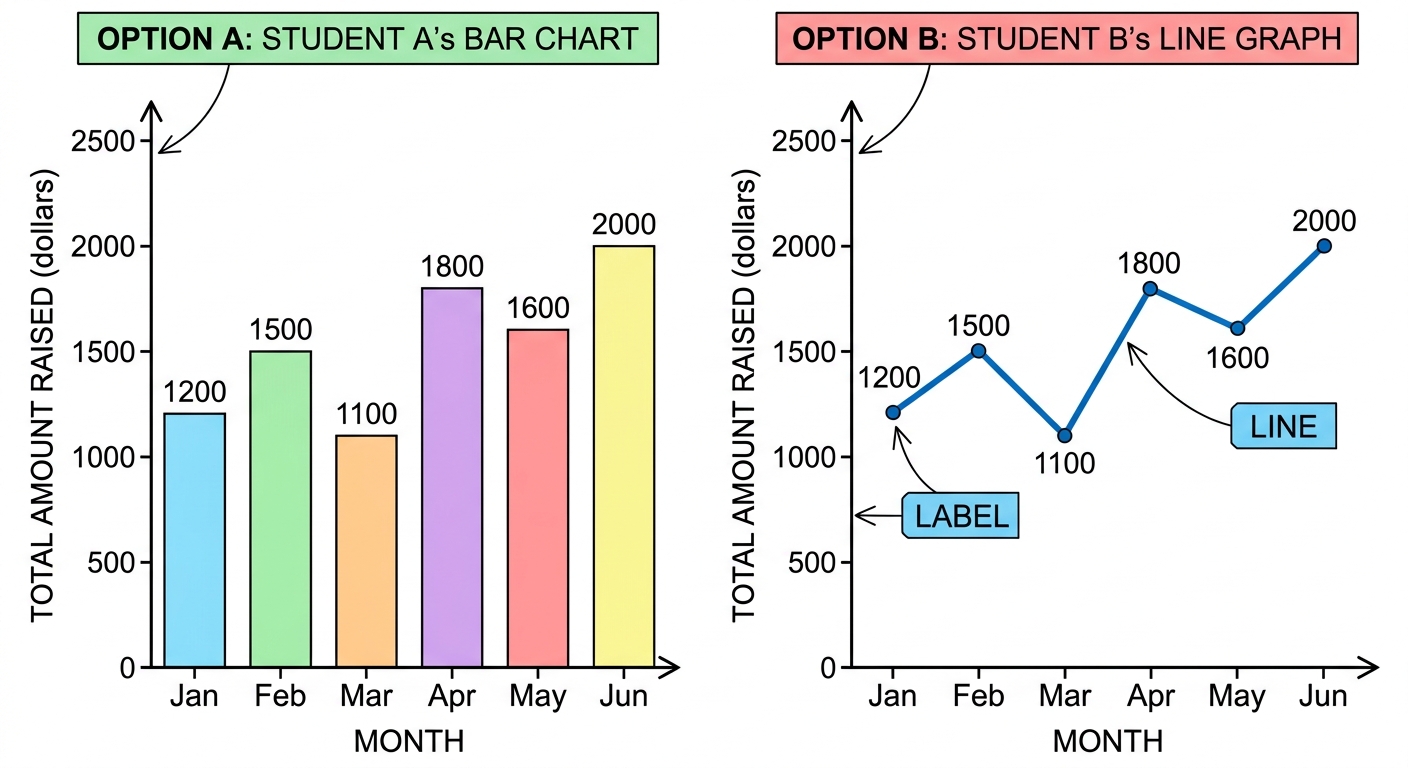
A school recorded the total money raised each month in a fundraiser from January to June.
Two students disagree about how to display this data for parents.
Student A says a line graph is best because it shows change over time.
Student B says a bar chart is better because the data is not continuous.
| Month | January | February | March | April | May | June |
|---|---|---|---|---|---|---|
| Amount raised (dollars) | 1200 | 1500 | 1100 | 1800 | 1600 | 2000 |
Two students disagree about how to display this data for parents.
Student A says a line graph is best because it shows change over time.
Student B says a bar chart is better because the data is not continuous.
a
Explain why using a line graph could be misleading for this data. [2]
b
Explain one limitation of using a bar chart to display this data. [2]
Solutions
3QuestionConverting Frequency into Angles for Pie ChartsAssessment Practice
4 marks~6 minCriterion D
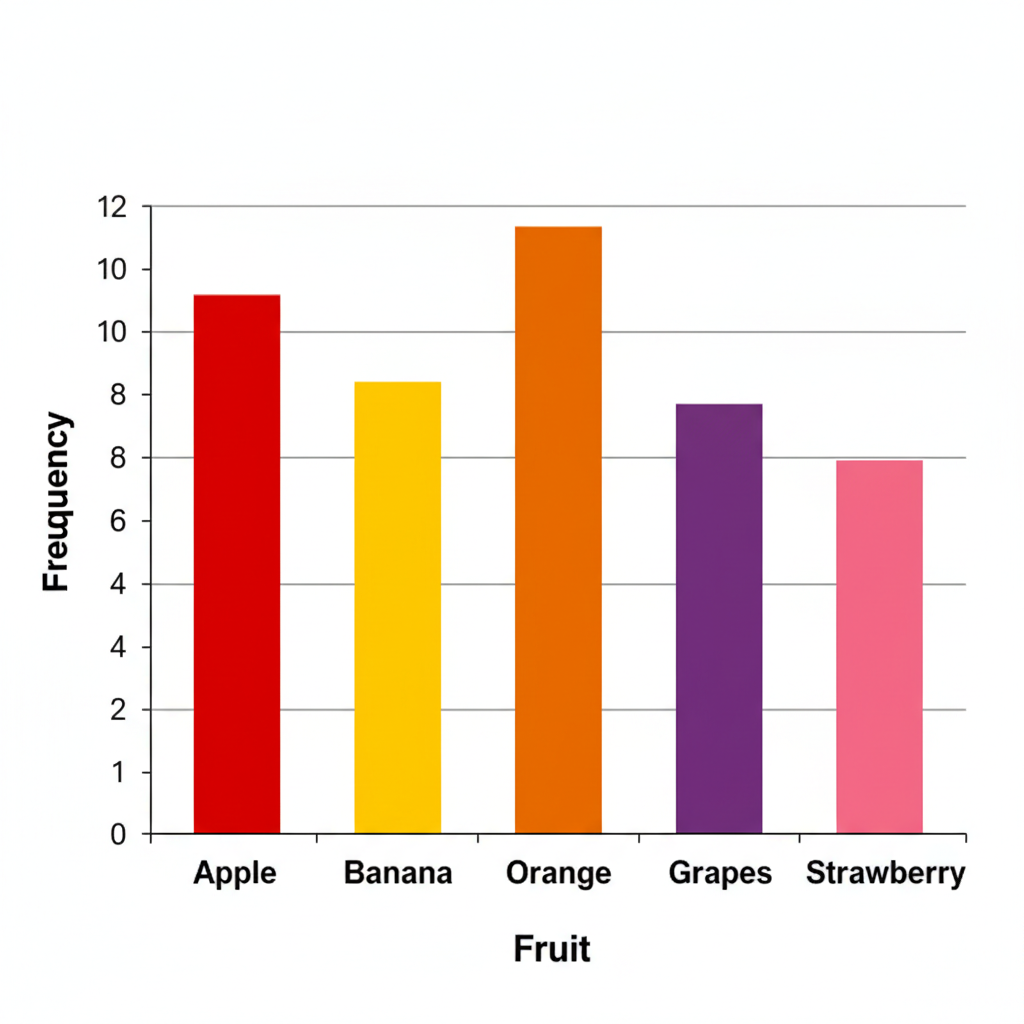
A student surveys 30 classmates about their favourite fruit. The bar chart shows the results.
a
Calculate the pie chart angle for each fruit. [2]
b
The student discovers that 5 classmates were each asked twice, so their responses were recorded twice. Explain how this double-counting affects the pie chart angles calculated in part (a). [2]
Solutions
4QuestionPlotting and Analyzing Line GraphsAssessment Practice
10 marks~15 minCriterion B
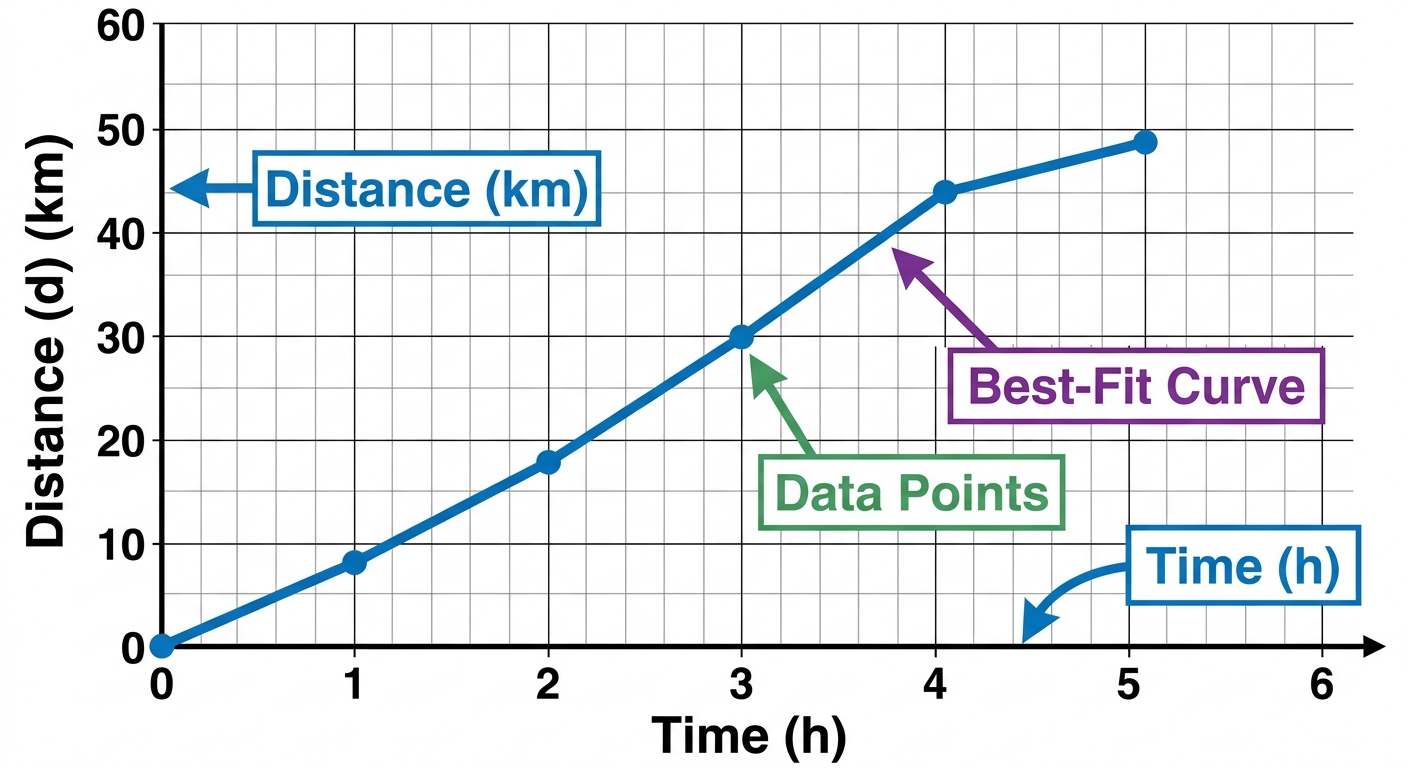
A cyclist records the distance travelled each hour during a 5-hour ride.
| Hour () | 0 | 1 | 2 | 3 | 4 | 5 |
|---|---|---|---|---|---|---|
| Distance (, km) | 0 | 8 | 18 | 30 | 44 | 60 |
a
Plot a line graph of distance against hour on a suitable grid. Label both axes clearly. [2]
b
Calculate the difference in distance between each pair of consecutive hours. Describe the pattern you see and use it to predict the distance at hour 6. [4]
c
Analyse the differences to explain why the relationship between and is quadratic, and write a formula for in terms of . Verify your formula for and . [4]
Solutions
That's every free question here — 4 of 71.
+67 more questions, plus Mock Papers & Worksheets, are waiting in Premium.