You're viewing free preview questions — 4 questions previewing here — subscribe to unlock 70 more, plus the Full Question Bank, Mock Papers & Worksheets.Upgrade
Designing and Conducting Surveys — Free MYP3 Mathematics Practice Questions

1QuestionChoosing Sample Size and Target GroupConcept Practice
2 marks~3 minCriterion A
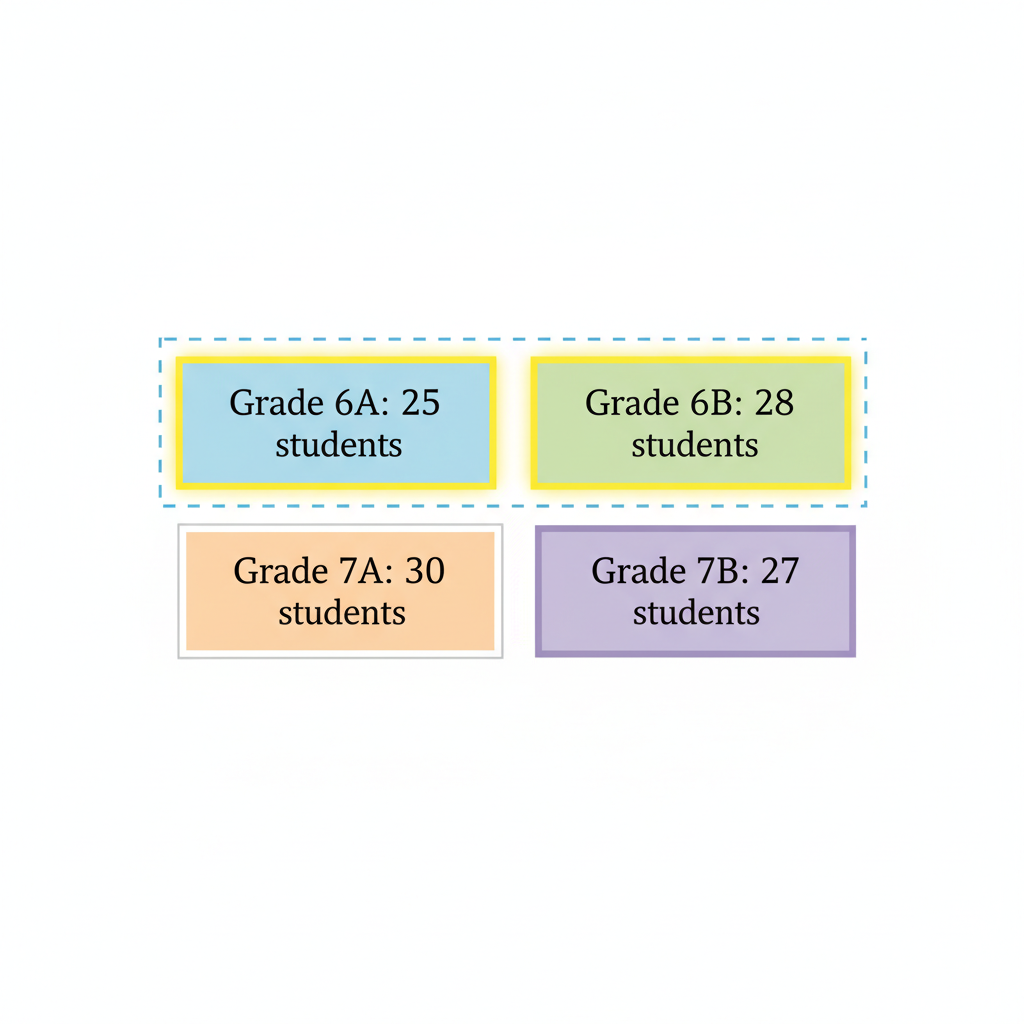
A school survey is being planned. The number of students in each class is shown below.
Grade 6A: 25 students
Grade 6B: 28 students
Grade 7A: 30 students
Grade 7B: 27 students
The target group for the survey is all Grade 6 students.
Calculate the total number of students in the target group. [2]
Grade 6A: 25 students
Grade 6B: 28 students
Grade 7A: 30 students
Grade 7B: 27 students
The target group for the survey is all Grade 6 students.
Calculate the total number of students in the target group. [2]

Solutions
2QuestionAvoiding Bias in Data CollectionAssessment Practice
2 marks~3 minCriterion D
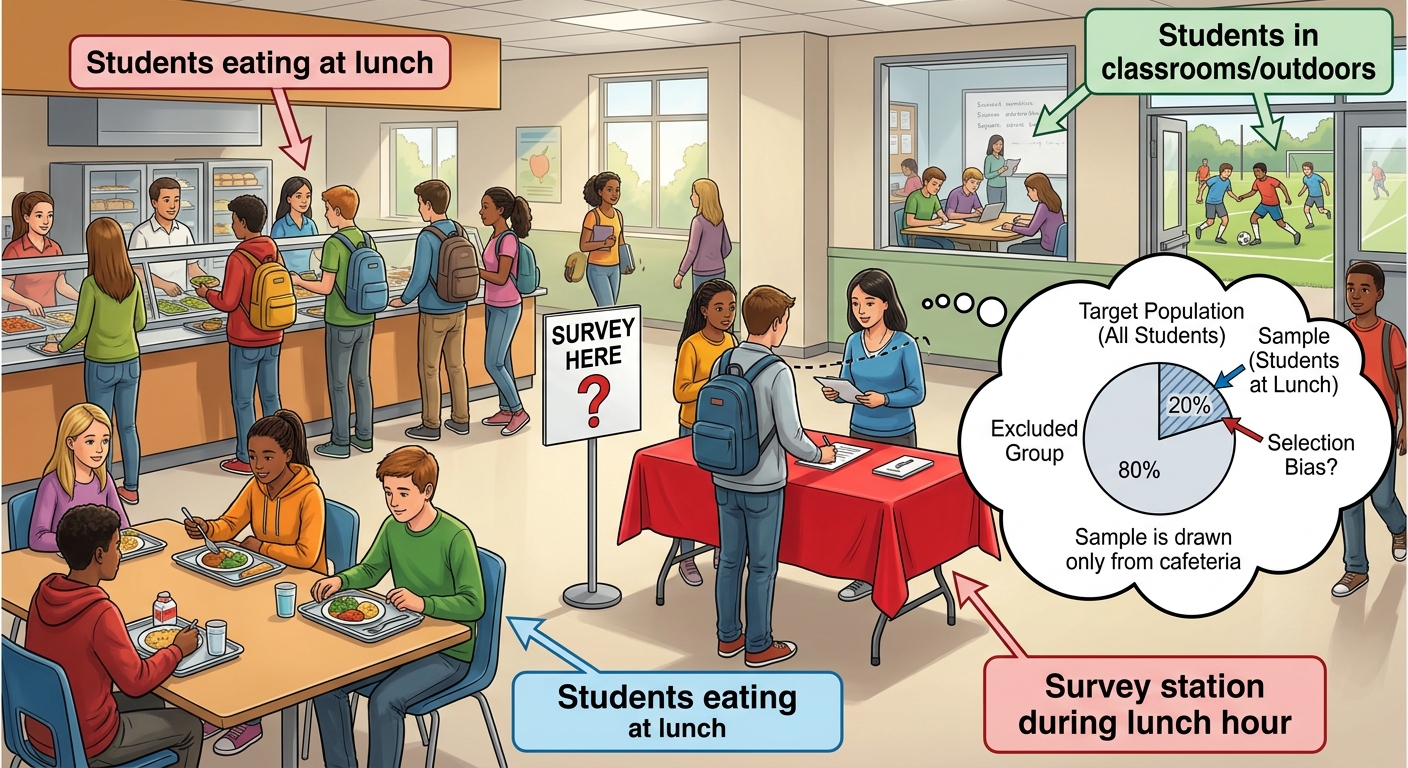
A school surveys student opinions on cafeteria food by interviewing only students present in the cafeteria at lunchtime.
a
Explain how surveying only lunchtime cafeteria visitors creates selection bias. [1]
b
Propose one alternative sampling method and explain how it would produce a more representative sample of the whole student population. [1]
Solutions
3QuestionChoosing Sample Size and Target GroupConcept Practice
2 marks~3 minCriterion B
A survey estimates the percentage of students who walk to school. The table below shows sample size and the corresponding margin of error.
| Sample size () | 10 | 20 | 50 | 100 | 200 |
|---|---|---|---|---|---|
| Margin of error (\%) | 32 | 22 | 14 | 10 | 7 |
a
Describe the relationship between sample size and margin of error. [1]
b
Estimate the margin of error for a sample size of 400 students. Justify your answer using the data in the table. [1]
Solutions
4QuestionCreating Effective Survey QuestionsAssessment Practice
5 marks~8 minCriterion C
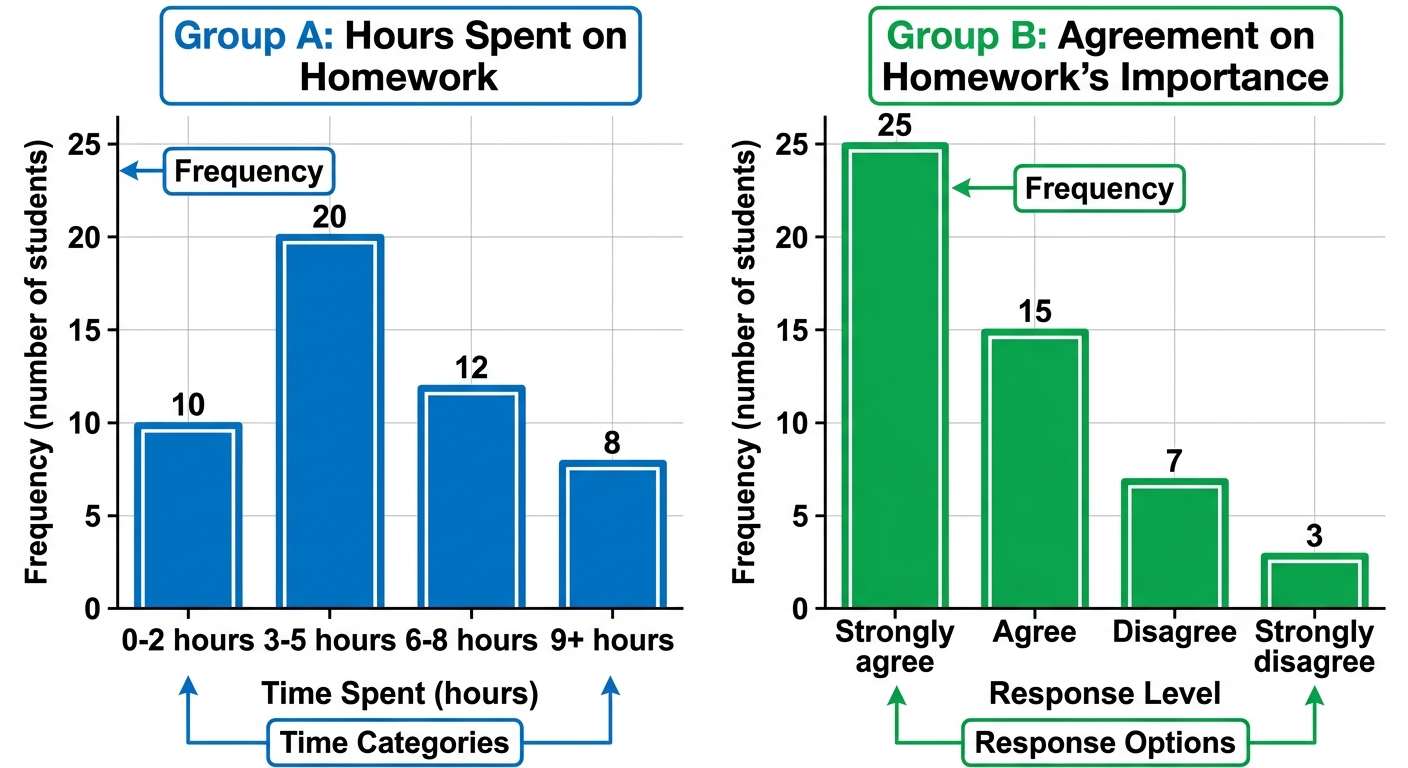
A student surveyed two separate groups of 50 students about homework.
Group A: "How many hours per week do you spend on homework?"
Group B: "Do you agree that homework is essential for learning?"
The bar charts below display these results.
Group A: "How many hours per week do you spend on homework?"
| Response options | 0–2 hours | 3–5 hours | 6–8 hours | 9+ hours |
|---|---|---|---|---|
| Results | 10 | 20 | 12 | 8 students |
Group B: "Do you agree that homework is essential for learning?"
| Response options | Strongly agree | Agree | Disagree | Strongly disagree |
|---|---|---|---|---|
| Results | 25 | 15 | 7 | 3 students |
The bar charts below display these results.
a
Describe one feature of Question B's wording that could influence how students respond. [1]
b
Explain how the response options in Question B could contribute to response bias. [2]
c
Justify which survey question is biased by comparing specific values from both bar charts. [2]
Solutions
That's every free question here — 4 of 74.
+70 more questions, plus Mock Papers & Worksheets, are waiting in Premium.