You're viewing free preview questions — 4 questions previewing here — subscribe to unlock 72 more, plus the Full Question Bank, Mock Papers & Worksheets.Upgrade
Frequency Tables and Tally Charts — Free MYP3 Mathematics Practice Questions

1QuestionUsing Tally Charts for CountingConcept Practice
2 marks~3 minCriterion A
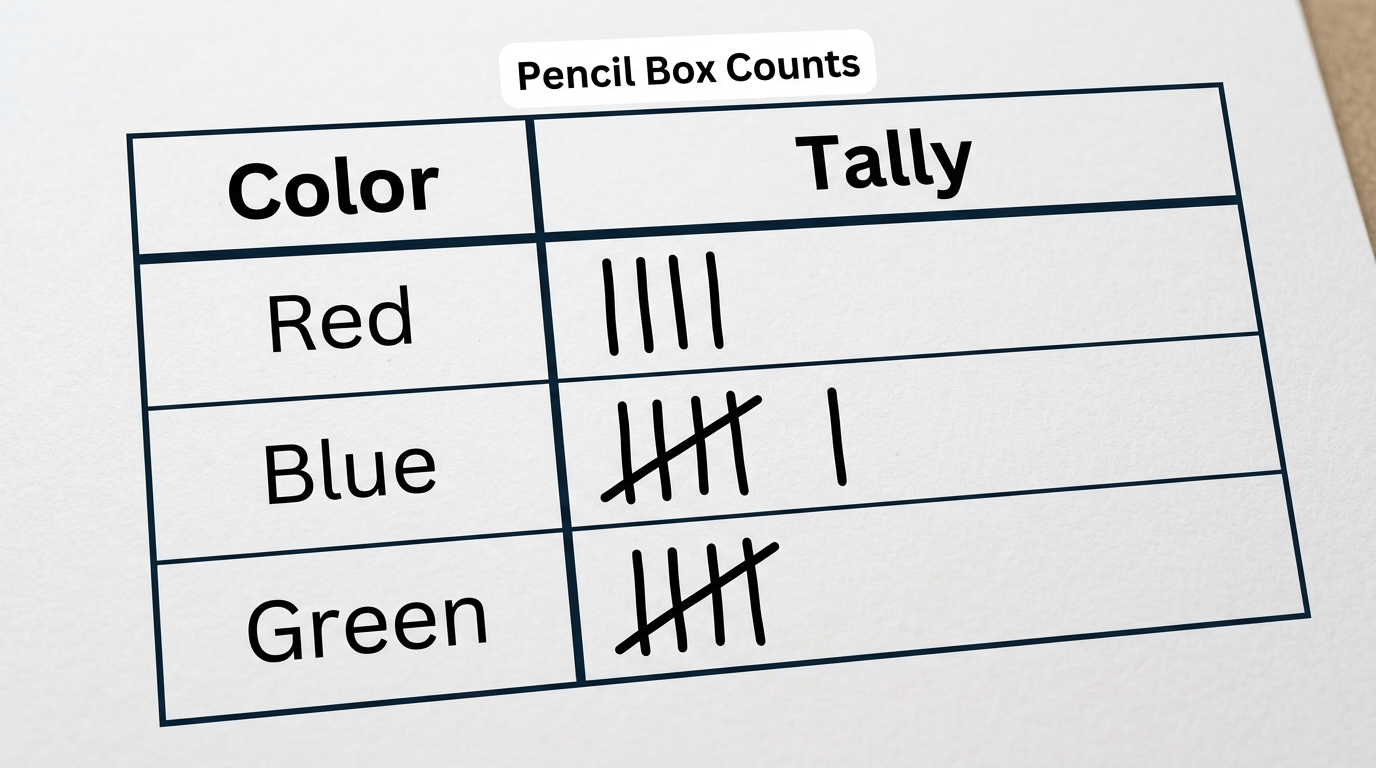
A tally chart shows the number of coloured pencils in a box.
(a) Interpret the tally marks for blue pencils and calculate the total number of blue pencils in the box. [2]
| Color | Red | Blue | Green |
|---|---|---|---|
| Tally |
(a) Interpret the tally marks for blue pencils and calculate the total number of blue pencils in the box. [2]

Solutions
2QuestionReading and Interpreting Frequency DataAssessment Practice
4 marks~6 minCriterion C
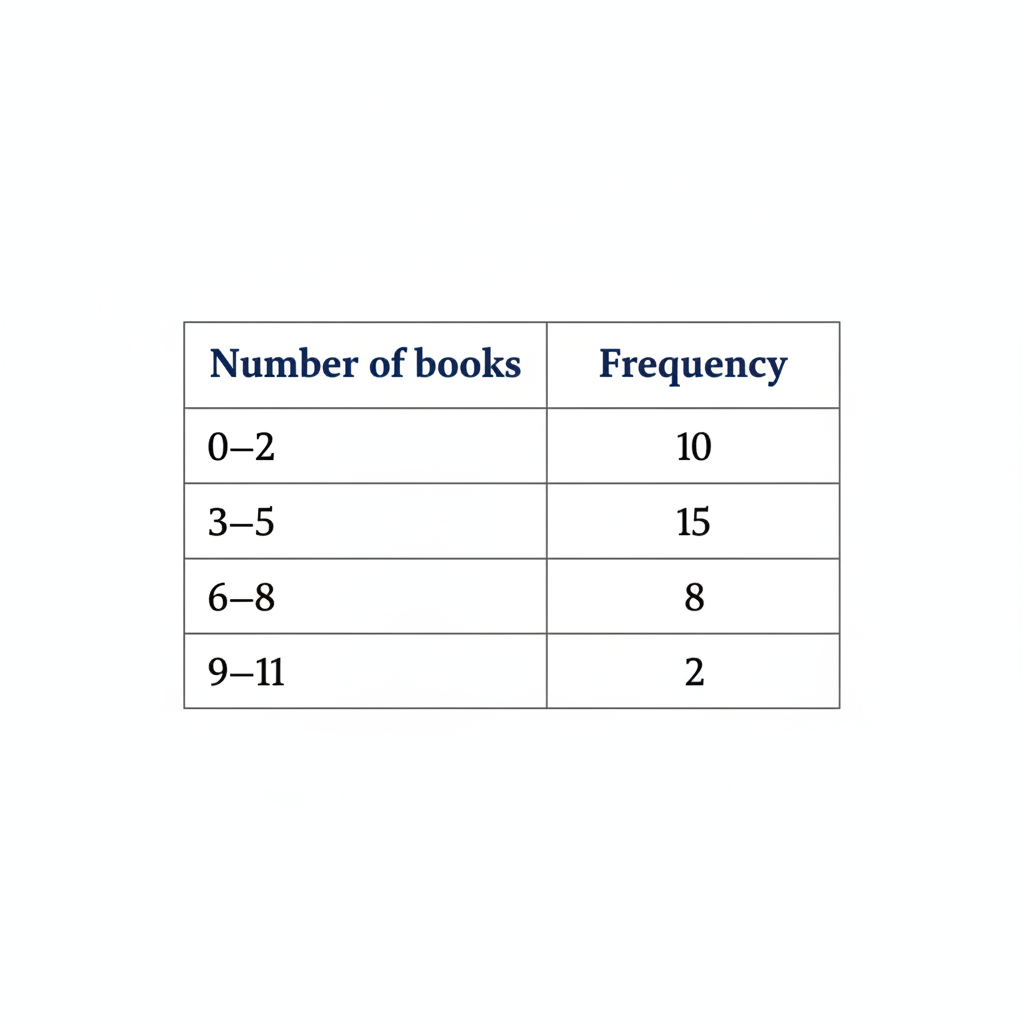
A school records the number of books read by each student in one month in the grouped frequency table below.
The school estimates the mean using the midpoint of each group: 1, 4, 7, 10.
| Number of books | 0–2 | 3–5 | 6–8 | 9–11 |
|---|---|---|---|---|
| Frequency | 10 | 15 | 8 | 2 |
The school estimates the mean using the midpoint of each group: 1, 4, 7, 10.
a
Calculate the estimated mean number of books read per student. Show all working. [2]
b
Explain why grouping the data means the estimated mean may not reflect students' actual reading habits. [2]
Solutions
3QuestionReading and Interpreting Frequency DataAssessment Practice
6 marks~9 minCriterion D
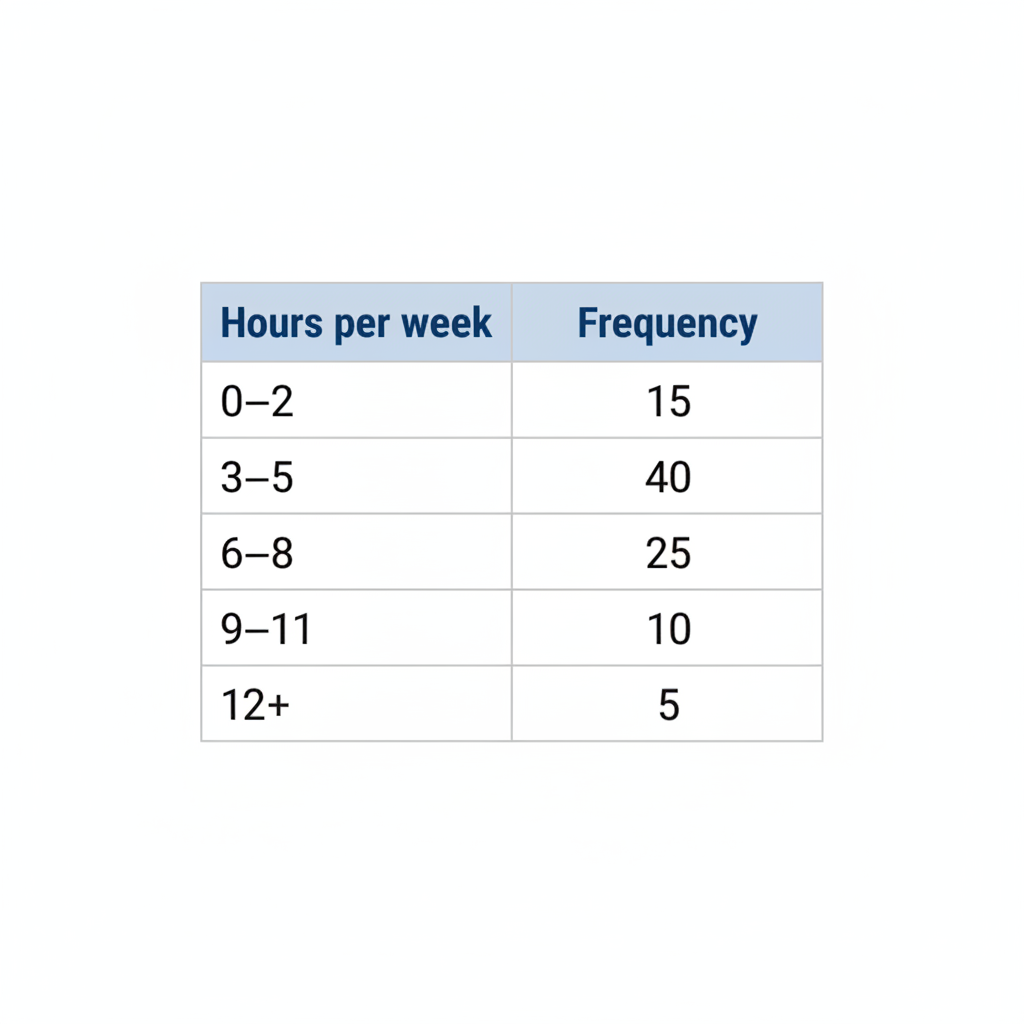
A student council surveys students about weekly homework hours. Classmates collect responses during lunch. The results are shown below.
| Hours per week | 0–2 | 3–5 | 6–8 | 9–11 | 12+ |
|---|---|---|---|---|---|
| Frequency | 15 | 40 | 25 | 10 | 5 |
a
Calculate the total number of students surveyed and the percentage of students in the 3–5 hour category. [2]
b
Explain why collecting data only during lunch may affect how well the results represent the whole school. [2]
c
Analyse whether the data supports the conclusion that most students spend 3–5 hours on homework per week. [2]
Solutions
4QuestionUsing Tally Charts for CountingAssessment Practice
8 marks~12 minCriterion B
A tally chart records counts using groups of 5 marks (four vertical lines crossed by one diagonal). The table below shows data from one chart.
Total tally marks: 5, 10, 15, 20, 25
Total tally marks: 5, 10, 15, 20, 25
| Complete groups | 1 | 2 | 3 | 4 | 5 |
|---|---|---|---|---|---|
| Leftover marks | 0 | 0 | 0 | 0 | 0 |
a
Describe the relationship between the total number of tally marks and the number of complete groups shown in the table. [1]
b
A tally chart shows 4 complete groups and 3 leftover marks. Calculate the total number of tally marks and explain why your method works. [3]
c
A student claims: "If two tally charts both show a total of 37 tally marks, they must have the same number of complete groups and the same number of leftover marks." Analyse this claim and justify your answer using the rule , where . [4]
Solutions
That's every free question here — 4 of 76.
+72 more questions, plus Mock Papers & Worksheets, are waiting in Premium.