You're viewing free preview questions — 4 questions previewing here — subscribe to unlock 53 more, plus the Full Question Bank, Mock Papers & Worksheets.Upgrade
Box Plots and Interquartile Range — Free MYP3 Mathematics Practice Questions

1QuestionCalculating and Interpreting the Interquartile RangeConcept Practice
2 marks~3 minCriterion A
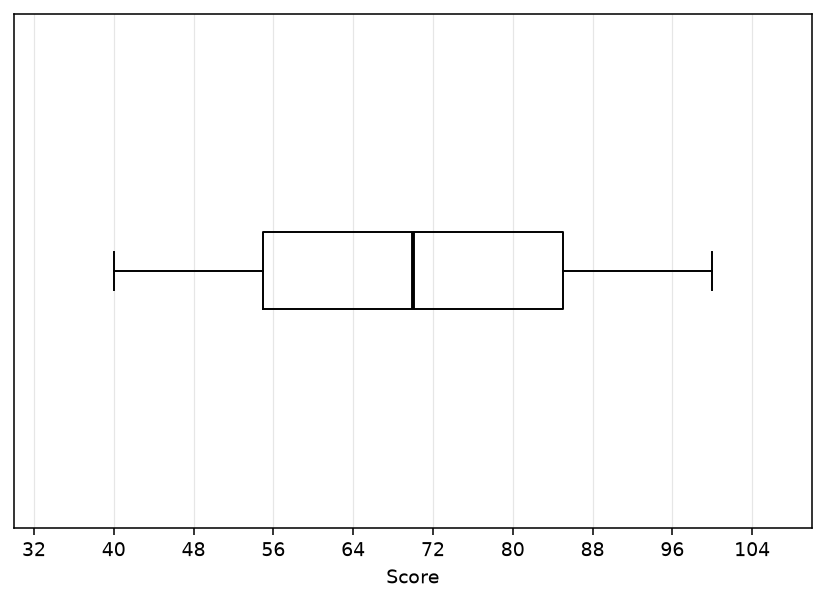
The box plot below shows the distribution of test scores for a class.
Minimum: 40 — : 55 — Median: 70 — : 85 — Maximum: 100
Calculate the interquartile range (IQR) of the test scores. [2]
Minimum: 40 — : 55 — Median: 70 — : 85 — Maximum: 100
Calculate the interquartile range (IQR) of the test scores. [2]

Solutions
2QuestionComparing Data Sets Using Box PlotsAssessment Practice
5 marks~8 minCriterion C
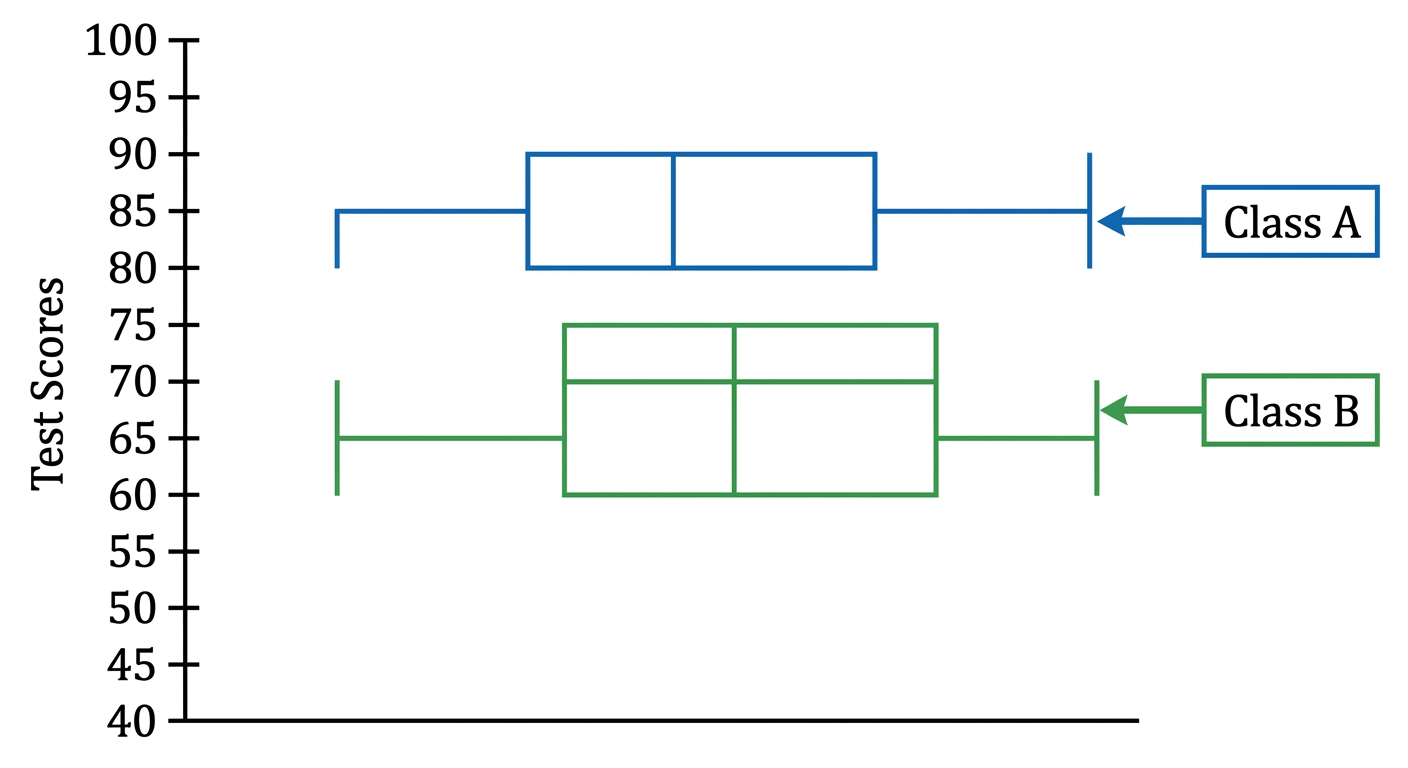
The box plots below show the mathematics exam scores for Class A and Class B.
| Class A | Minimum 45 | Median | Maximum 90 | ||
|---|---|---|---|---|---|
| Class B | Minimum 50 | Median | Maximum 95 |
a
Calculate the interquartile range (IQR) for each class. [2]
b
Compare the medians of the two classes. Explain what this tells you about overall performance. [1]
c
A student claims: "Class B performed better overall and had more consistent scores." Using your results from (a) and (b), analyse whether this claim is fully correct, partially correct, or incorrect. Justify your answer. [2]
Solutions
3QuestionComparing Data Sets Using Box PlotsAssessment Practice
6 marks~9 minCriterion D
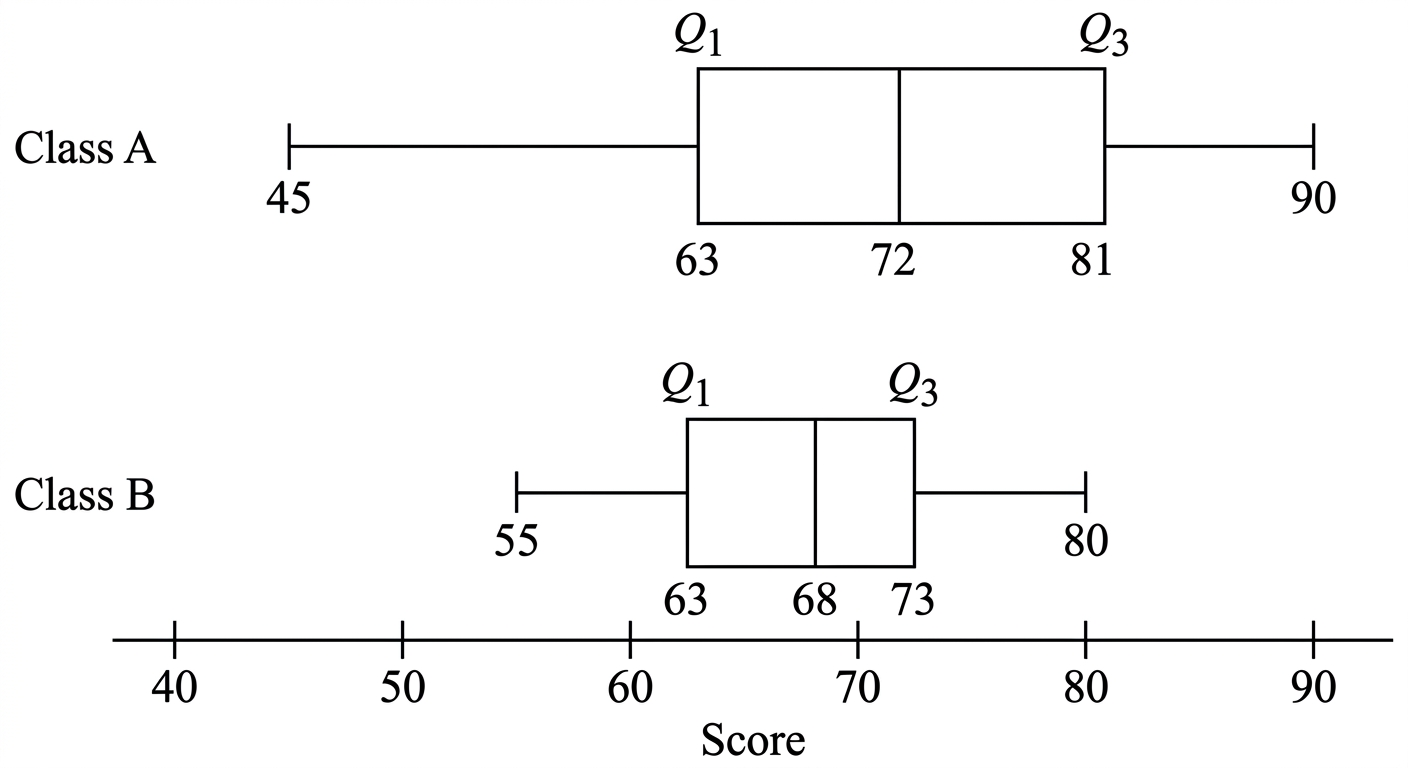
Two mathematics classes took the same test. Their results are shown in the box plots.
| Class A | median | range | |
|---|---|---|---|
| Class B | median | range |
a
State the median score for each class. [1]
b
Compare the IQRs of the two classes. Explain what the difference in IQRs indicates about the consistency of scores in each class. [2]
c
The principal wants to award a prize to the class that performed better overall. Analyse whether the median alone is sufficient to make this decision, using the IQR and range to support your answer. [3]
Solutions
4QuestionDrawing Box Plots from Data SetsAssessment Practice
6 marks~9 minCriterion B
Five data sets, each with a median of 10, are shown below.
Data Set A: (range )
Data Set B: (range )
Data Set C: (range )
Data Set D: (range )
Data Set E: (range )
Data Set A: (range )
Data Set B: (range )
Data Set C: (range )
Data Set D: (range )
Data Set E: (range )
a
Calculate the IQR for each data set. Show your working. [2]
b
Describe the relationship between the range and the IQR for these data sets, and state a general rule linking IQR to range for symmetric, equally spaced sets of five values. [2]
c
A new data set has the same structure, a median of 10, and a range of 24. Calculate the IQR you would expect, then verify your answer by finding and for the data set . [2]
Solutions
That's every free question here — 4 of 57.
+53 more questions, plus Mock Papers & Worksheets, are waiting in Premium.