You're viewing free preview questions — 4 questions previewing here — subscribe to unlock 71 more, plus the Full Question Bank, Mock Papers & Worksheets.Upgrade
Working with Grouped Data — Free MYP3 Mathematics Practice Questions

1QuestionCalculating Midpoints for IntervalsConcept Practice
2 marks~3 minCriterion A
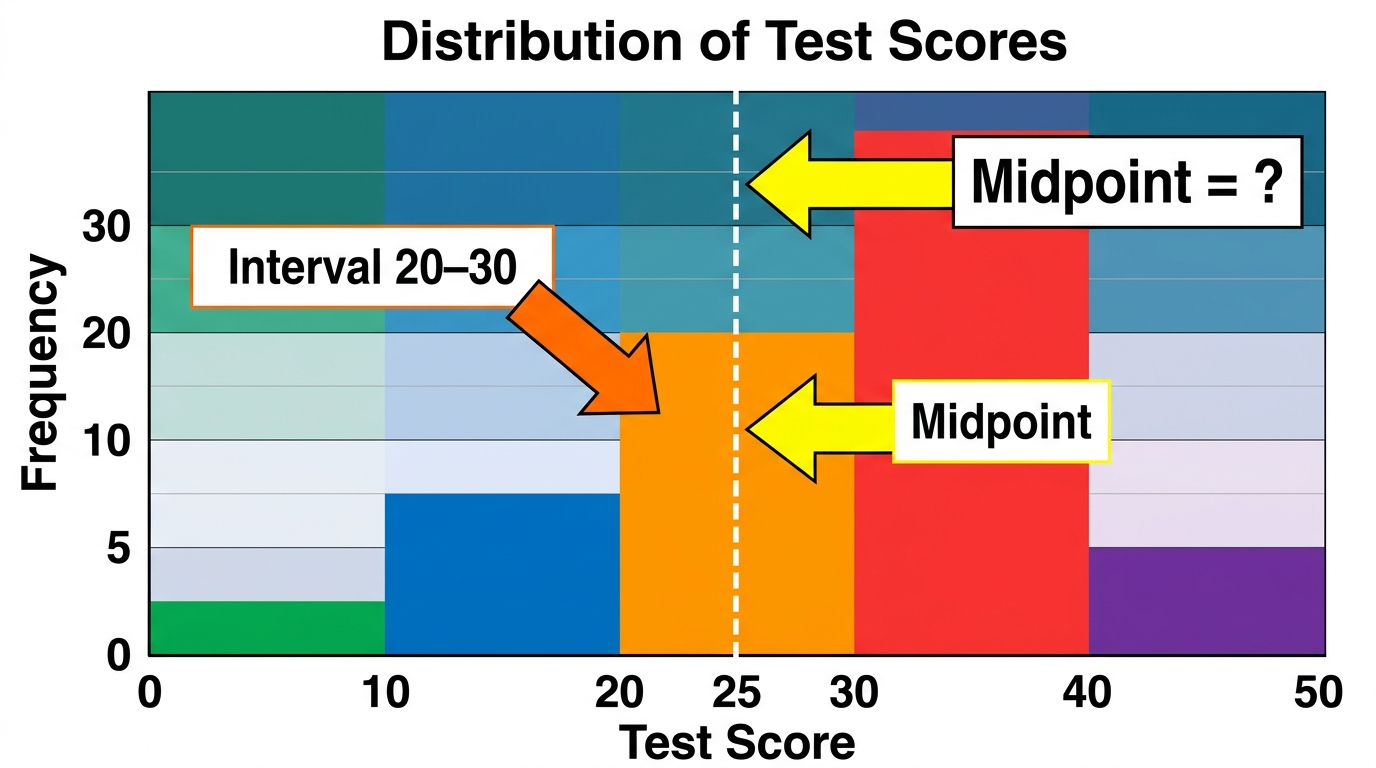
A teacher records student test scores in equal intervals: 0–10, 10–20, 20–30, 30–40, and 40–50.
a
Calculate the midpoint of the interval 20–30. [1]
b
Explain why statisticians use midpoints to represent all scores within an interval when working with grouped data. [1]

Solutions
2QuestionEstimating Mean from Grouped DataAssessment Practice
2 marks~3 minCriterion D
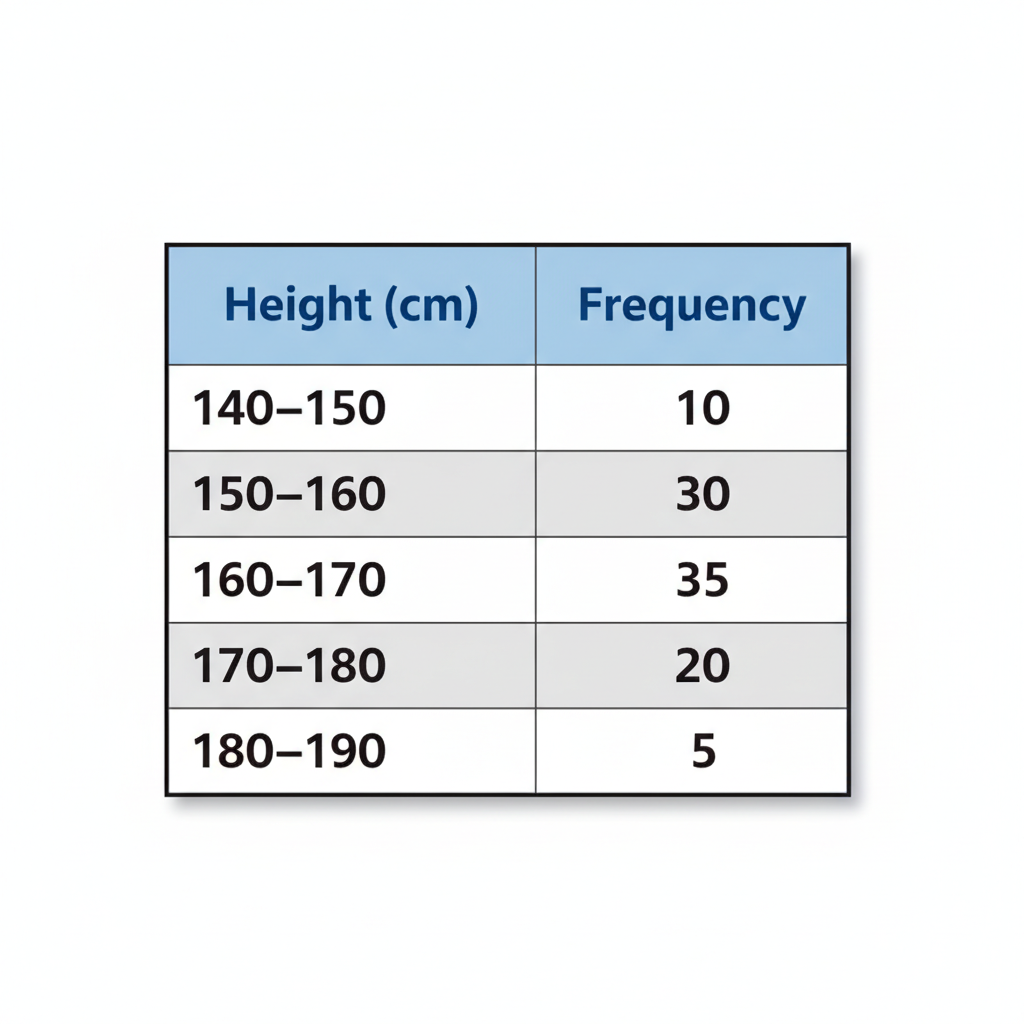
A school records the heights of 100 students in the following grouped frequency table.
| Height (cm) | 140–150 | 150–160 | 160–170 | 170–180 | 180–190 |
|---|---|---|---|---|---|
| Frequency | 10 | 30 | 35 | 20 | 5 |
a
Identify a specific real-world scenario in which estimating a mean from grouped height data would be useful. [1]
b
Explain one limitation of using an estimated mean in the scenario you identified. [1]
Solutions
3QuestionCalculating Midpoints for IntervalsConcept Practice
3 marks~5 minCriterion B
A survey records the ages of visitors to a museum. The grouped data are shown below.
| Interval | 0–10 | 10–20 | 20–30 | 30–40 | 40–50 |
|---|---|---|---|---|---|
| Midpoint | 5 | 15 | 25 | 35 | 45 |
a
Describe the pattern in the midpoints shown in the table. [1]
b
Calculate the midpoint of the interval 50–60. Show your method. [1]
c
A new interval has a midpoint of 75. Explain what the interval must be, and justify your answer using the midpoint formula. [1]
Solutions
4QuestionGrouping Data into Class IntervalsAssessment Practice
6 marks~9 minCriterion C
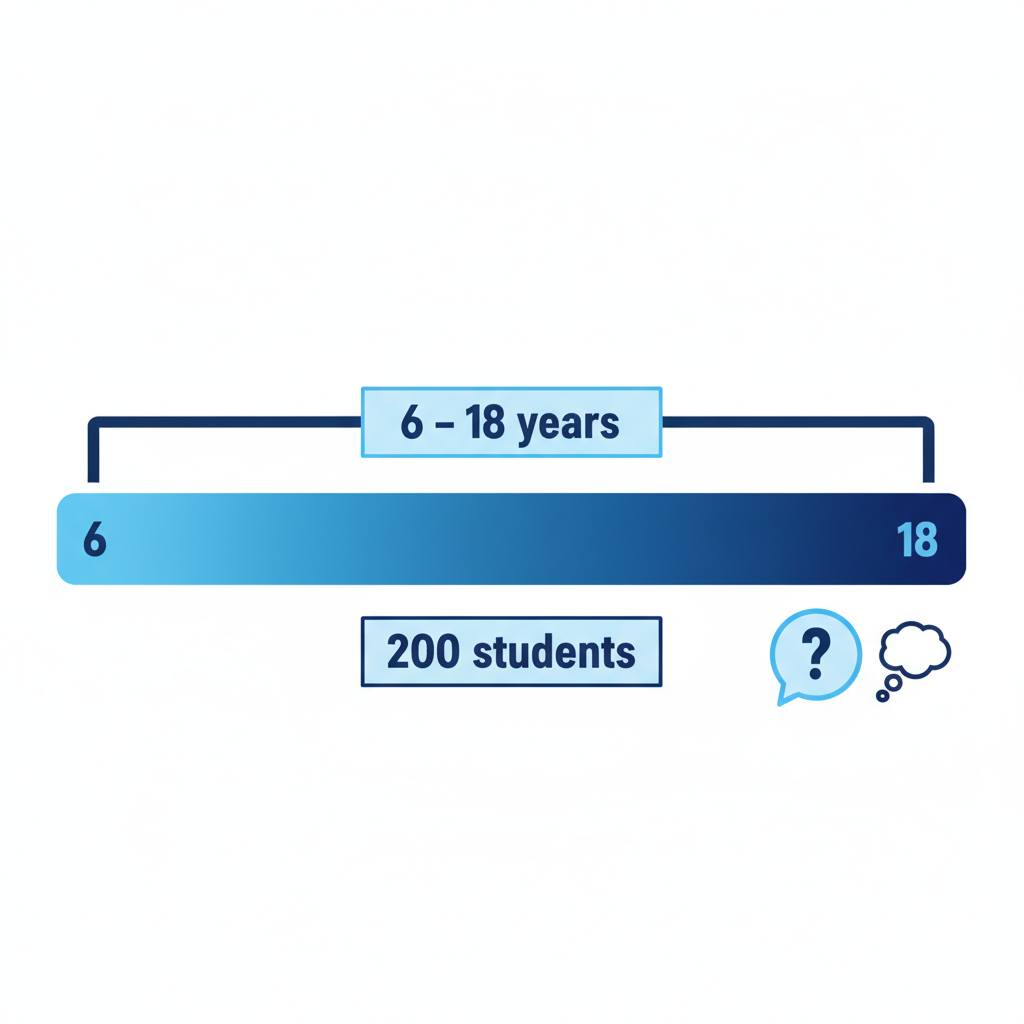
A school records the ages of 200 students in a sports club. Ages range from 6 to 18 years. The school groups all the data into one class interval: years.
a
Describe what information is hidden when all 200 students are placed into a single class interval. [2]
b
Propose a set of class intervals for this data and explain how your intervals improve understanding of the age distribution. [2]
c
Analyse one limitation of using class intervals to represent this data, even when the intervals are well chosen. [2]
Solutions
That's every free question here — 4 of 75.
+71 more questions, plus Mock Papers & Worksheets, are waiting in Premium.