You're viewing free preview questions — 5 questions previewing here — subscribe to unlock 66 more, plus the Full Question Bank, Mock Papers & Worksheets.Upgrade
Lifestyle Diseases — Free MYP4 Biology Practice Questions

1QuestionImpact of Diet on HealthConcept Practice
2 marks~3 minCriterion A
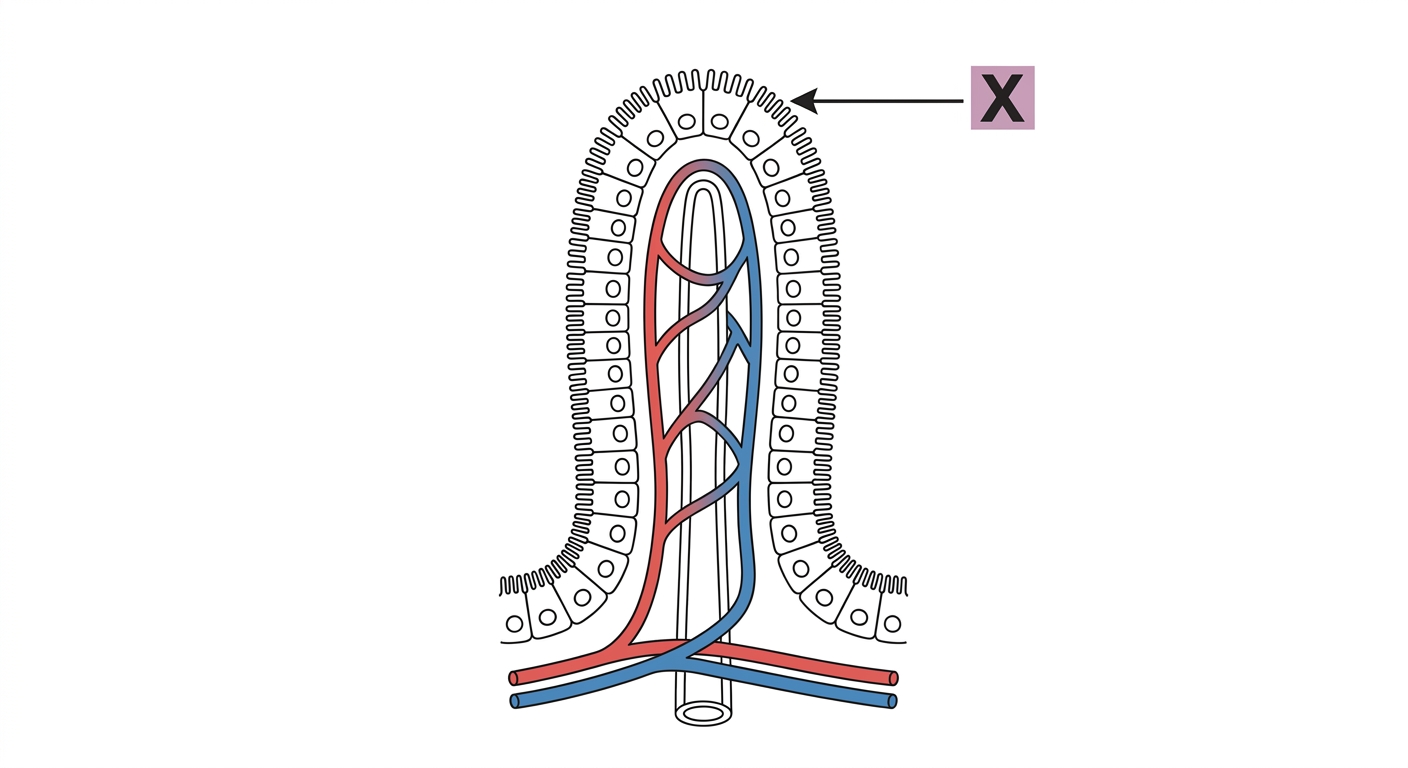
The diagram below shows a villus from the small intestine, with structures labeled X visible on the surface of the epithelial cells.
a
Identify the structures labeled X. [1]
b
Explain how these structures increase the efficiency of nutrient absorption in the small intestine. [1]

Solutions
2QuestionNon-Communicable Diseases OverviewAssessment Practice
3 marks~5 minCriterion C
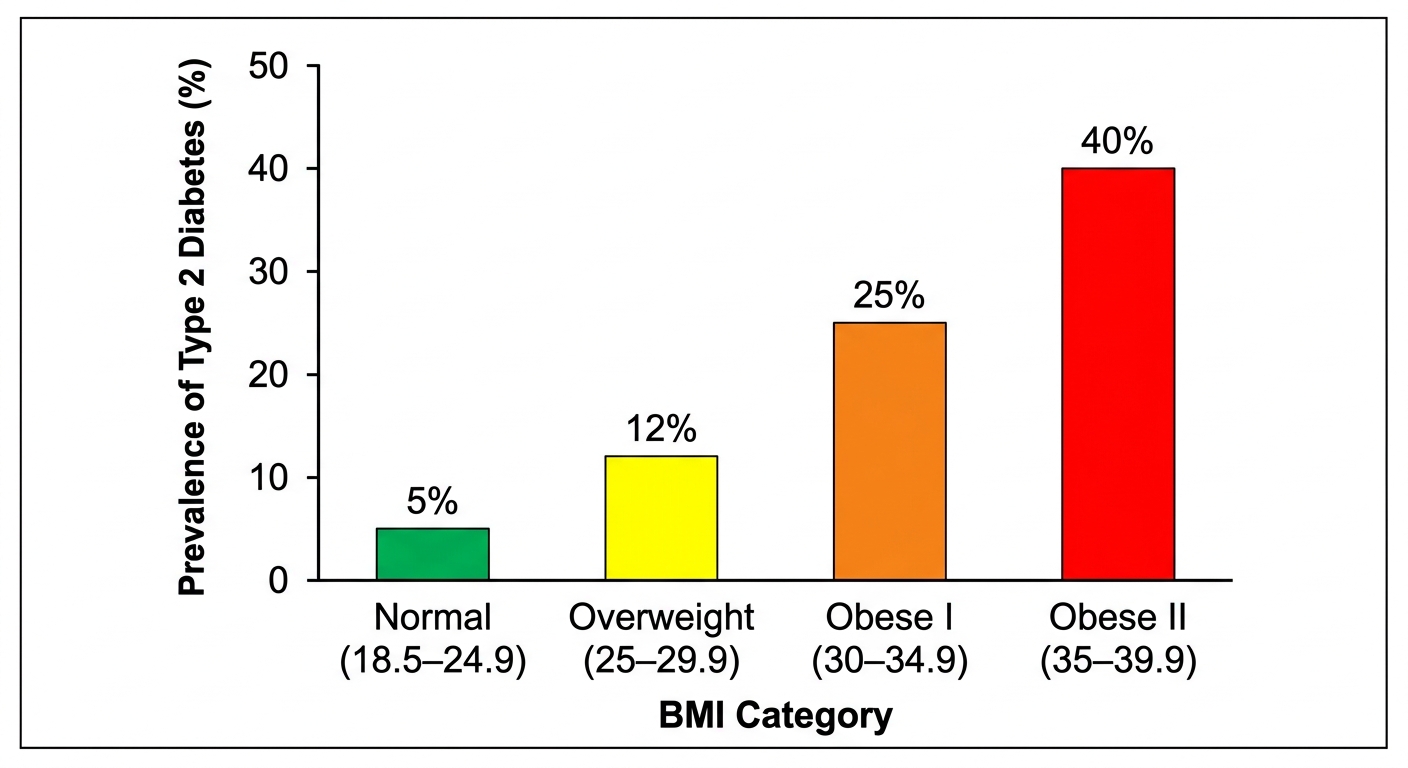
The bar chart below shows the prevalence of Type 2 diabetes in adults aged 40–60 across four BMI categories.
[Bar chart. X-axis: BMI Category — Normal (18.5–24.9), Overweight (25–29.9), Obese Class I (30–34.9), Obese Class II (35–39.9). Y-axis: Prevalence of Type 2 Diabetes (%). Bar heights: Normal 5%, Overweight 12%, Obese Class I 25%, Obese Class II 40%.]
[Bar chart. X-axis: BMI Category — Normal (18.5–24.9), Overweight (25–29.9), Obese Class I (30–34.9), Obese Class II (35–39.9). Y-axis: Prevalence of Type 2 Diabetes (%). Bar heights: Normal 5%, Overweight 12%, Obese Class I 25%, Obese Class II 40%.]
a
Describe the relationship between BMI category and the prevalence of Type 2 diabetes shown in the graph. Support your answer with data. [1]
b
Explain one biological mechanism by which excess body fat leads to insulin resistance. [1]
c
Explain how insulin resistance, if sustained, leads to the development of Type 2 diabetes mellitus. [1]
Solutions
3QuestionNon-Communicable Diseases OverviewAssessment Practice
6 marks~9 minCriterion B
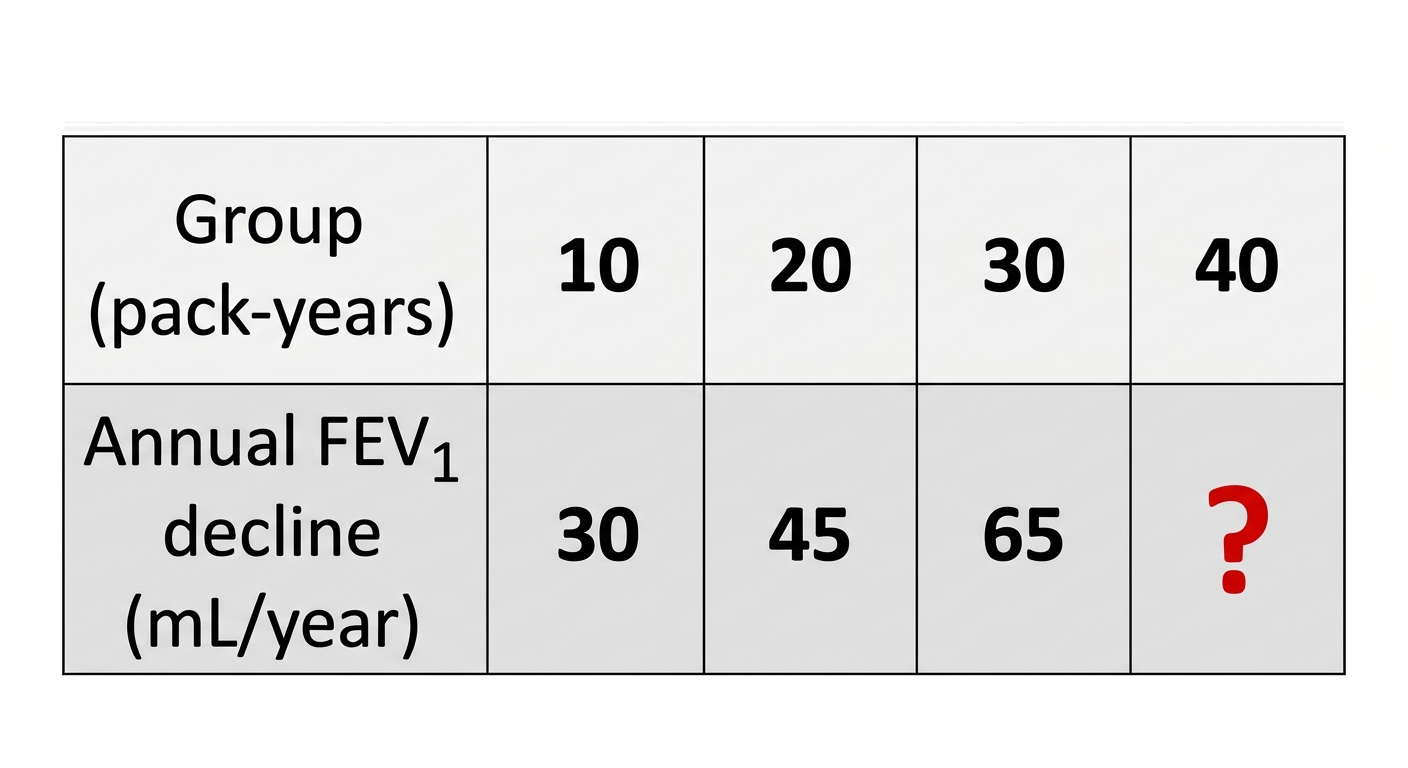
Forced expiratory volume in one second () measures how much air a person can forcibly exhale in one second; a lower value indicates poorer lung function. The table below shows the average annual decline in (mL per year) for groups of smokers with different cumulative smoking exposures measured in pack-years.
| Pack-years | 10 | 20 | 30 | 40 |
|---|---|---|---|---|
| Annual decline (mL/year) | 30 | 45 | 65 | ? |
a
Describe the pattern in the relationship between pack-years smoked and annual decline shown in the data. [2]
b
Deduce the annual decline for the 40 pack-year group, showing your reasoning clearly. [2]
c
Analyse how the biological processes of chronic airway inflammation and alveolar destruction explain why the rate of decline accelerates with increasing pack-years. [2]
Solutions
4QuestionCauses of Lifestyle DiseasesAssessment Practice
6 marks~9 minCriterion D
A 45-year-old woman has a strong family history of Type 2 diabetes. Her doctor offers a genetic screening test that estimates her lifetime risk of developing the disease. The test is not perfectly accurate: it can produce false positives (high-risk result for someone who will never develop diabetes) and false negatives (low-risk result for someone who will). Lifestyle factors such as diet and physical activity can significantly modify actual risk.
a
Explain one positive and one negative health implication for the woman if she receives a high-risk result. [2]
b
Discuss the ethical implications of sharing her genetic test results with her health insurance company or employer. [2]
c
Evaluate the reliability of genetic screening as a tool for predicting whether this woman will develop Type 2 diabetes, using evidence from the stem to support your judgement. [2]

Solutions
5QuestionCauses of Lifestyle DiseasesAssessment Practice
7 marks~11 minCriterion B
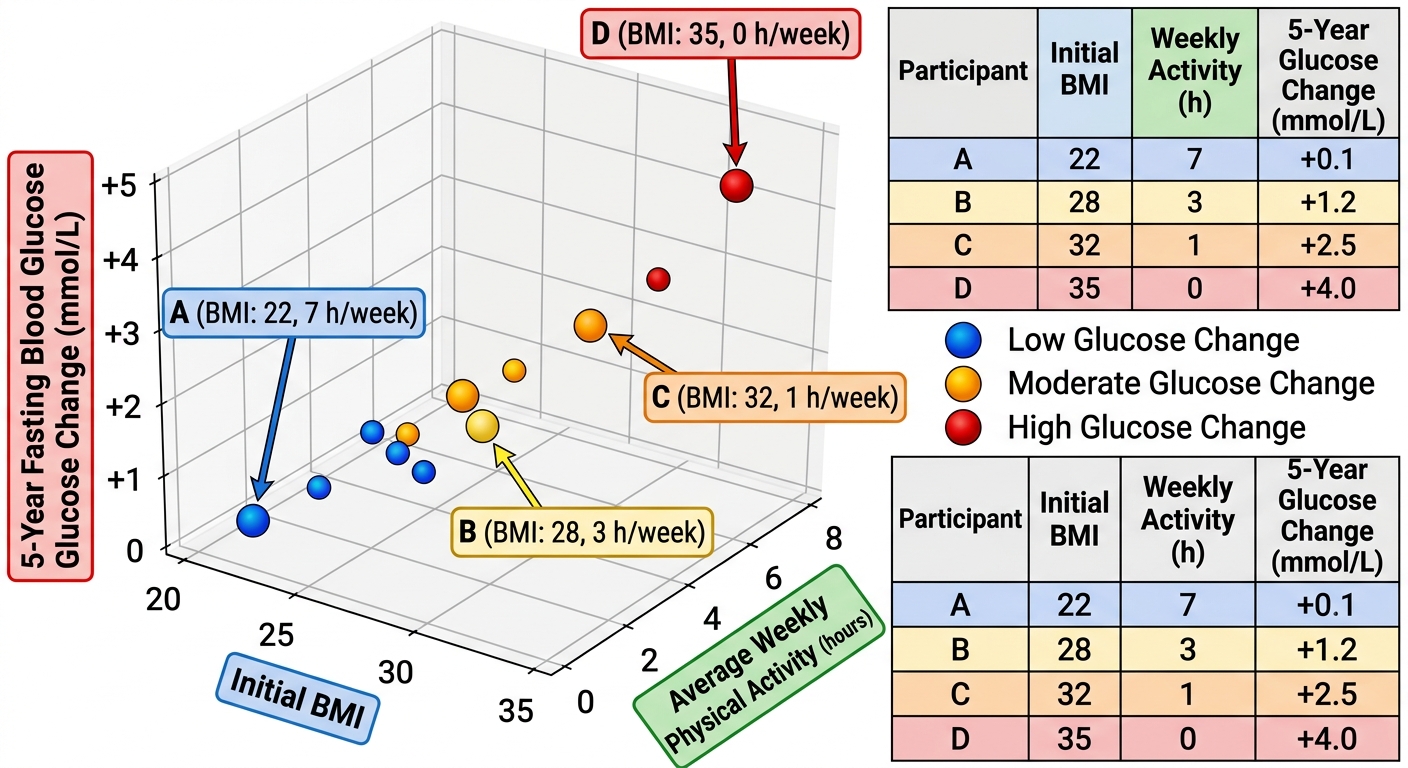
A study tracked 20 adults over five years, recording BMI, weekly physical activity (hours), and fasting blood glucose (mmol/L) at the start and end. The table below shows the five-year change in blood glucose for four representative individuals.
| Individual A | BMI 22 | activity 7 h/week | glucose change mmol/L |
|---|---|---|---|
| Individual B | BMI 28 | activity 3 h/week | glucose change mmol/L |
| Individual C | BMI 32 | activity 1 h/week | glucose change mmol/L |
| Individual D | BMI 35 | activity 0 h/week | glucose change mmol/L |
a
Interpret the pattern relating BMI, physical activity, and blood glucose change. State a general rule that predicts the risk of progressing from prediabetes to Type 2 diabetes based on these two factors. [2]
b
Deduce the expected five-year blood glucose change for an individual with BMI 30 and 2 h/week of physical activity. Show your reasoning. [2]
c
Justify why high BMI and low physical activity each contribute to rising blood glucose, and explain why their combined effect is greater than either factor alone. [3]
Solutions
That's every free question here — 5 of 71.
+66 more questions, plus Mock Papers & Worksheets, are waiting in Premium.