You're viewing free preview questions — 5 questions previewing here — subscribe to unlock 59 more, plus the Full Question Bank, Mock Papers & Worksheets.Upgrade
Vaccination — Free MYP4 Biology Practice Questions

1QuestionTypes of Vaccines (Examples of vaccines)Concept Practice
2 marks~3 minCriterion A
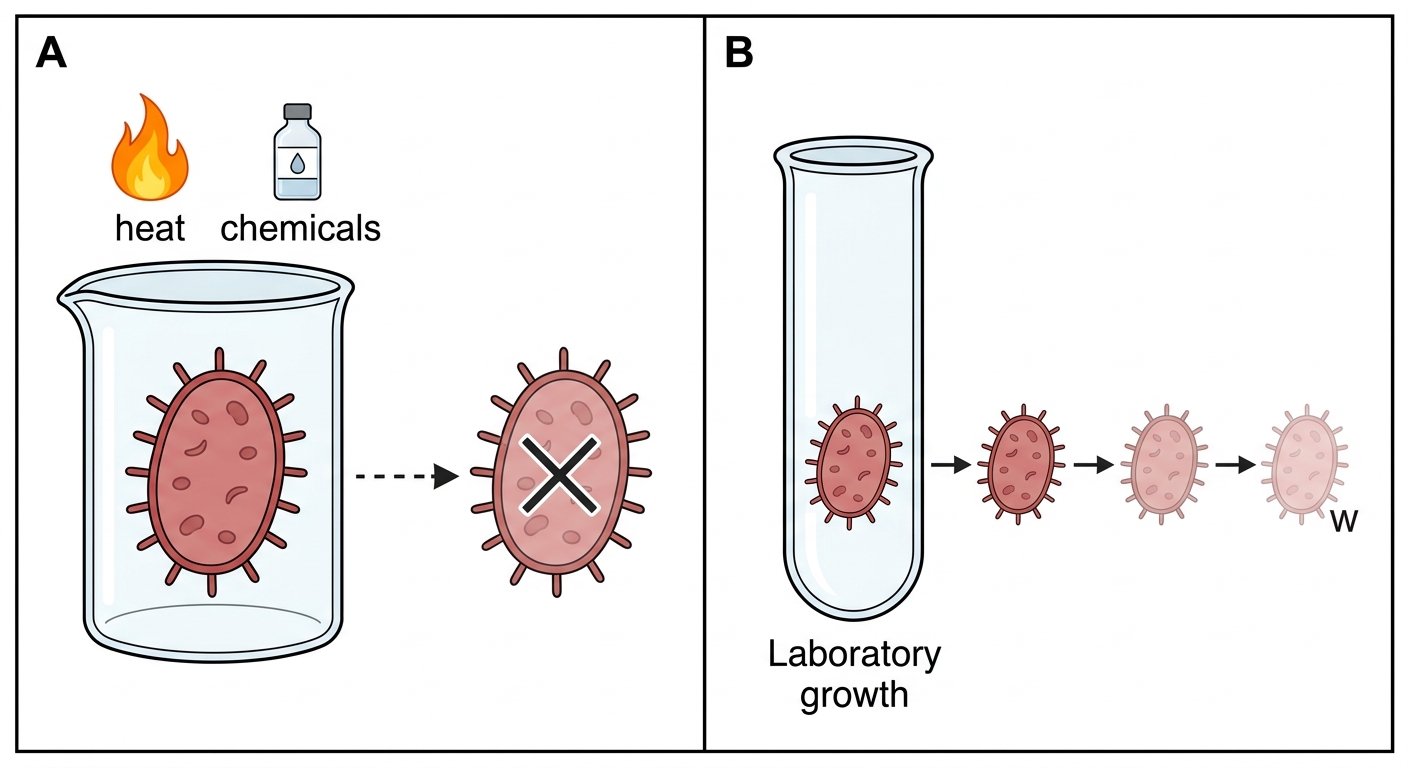
The diagram shows two methods of preparing vaccines. Diagram A shows a pathogen treated with heat or chemicals so it can no longer cause disease. Diagram B shows a pathogen grown repeatedly in a laboratory until it becomes too weak to cause disease in a healthy person.
a
Identify the type of vaccine shown in Diagram A and state one disease it prevents. [1]
b
Identify the type of vaccine shown in Diagram B and state one disease it prevents. [1]

Solutions
2QuestionTypes of Vaccines (Examples of vaccines)Assessment Practice
2 marks~3 minCriterion D
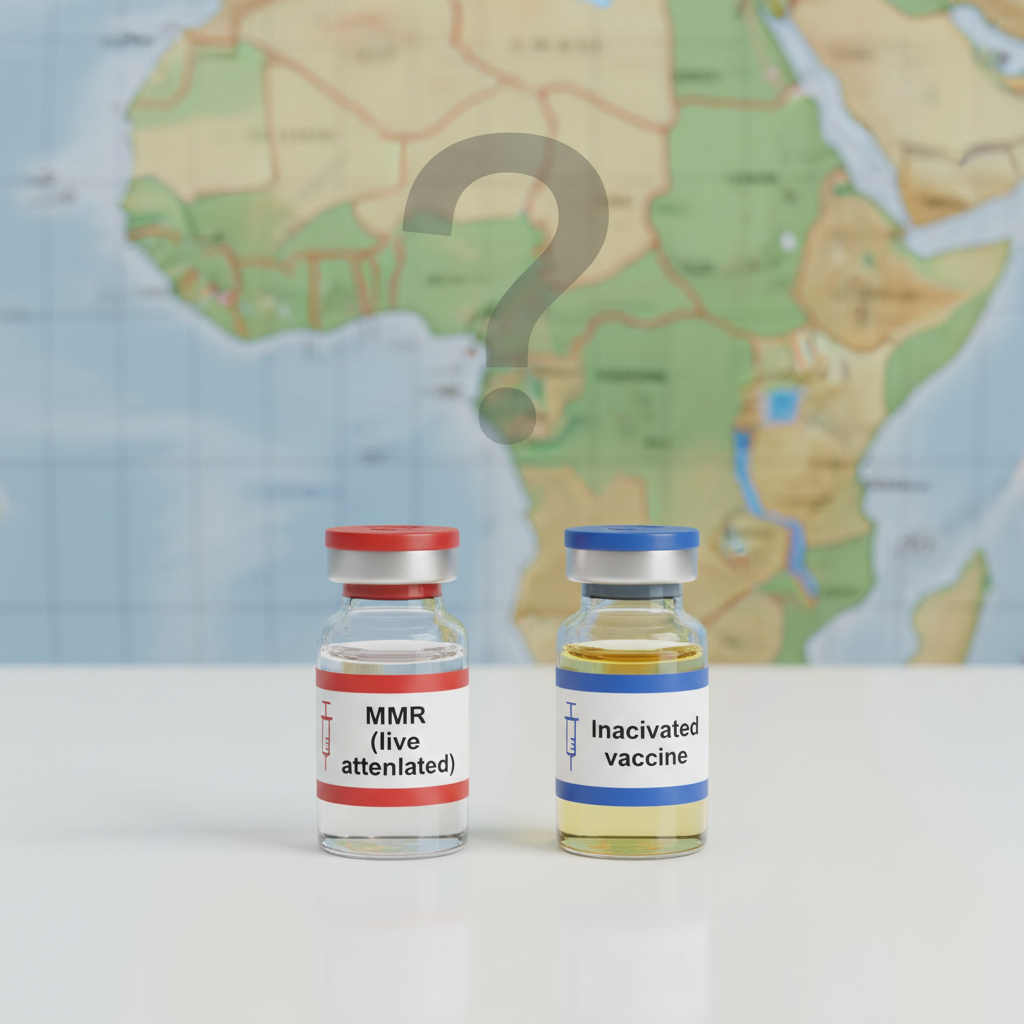
During a measles outbreak in a low-income country, health officials must choose between the MMR vaccine (live attenuated, higher efficacy) and a newer inactivated vaccine (lower efficacy, fewer side effects). Immunocompromised individuals are present in the population, and healthcare infrastructure is limited.
Outline one ethical issue that health officials face when deciding which vaccine to distribute. [2]
Outline one ethical issue that health officials face when deciding which vaccine to distribute. [2]
Solutions
3QuestionImportance of VaccinationAssessment Practice
3 marks~5 minCriterion B
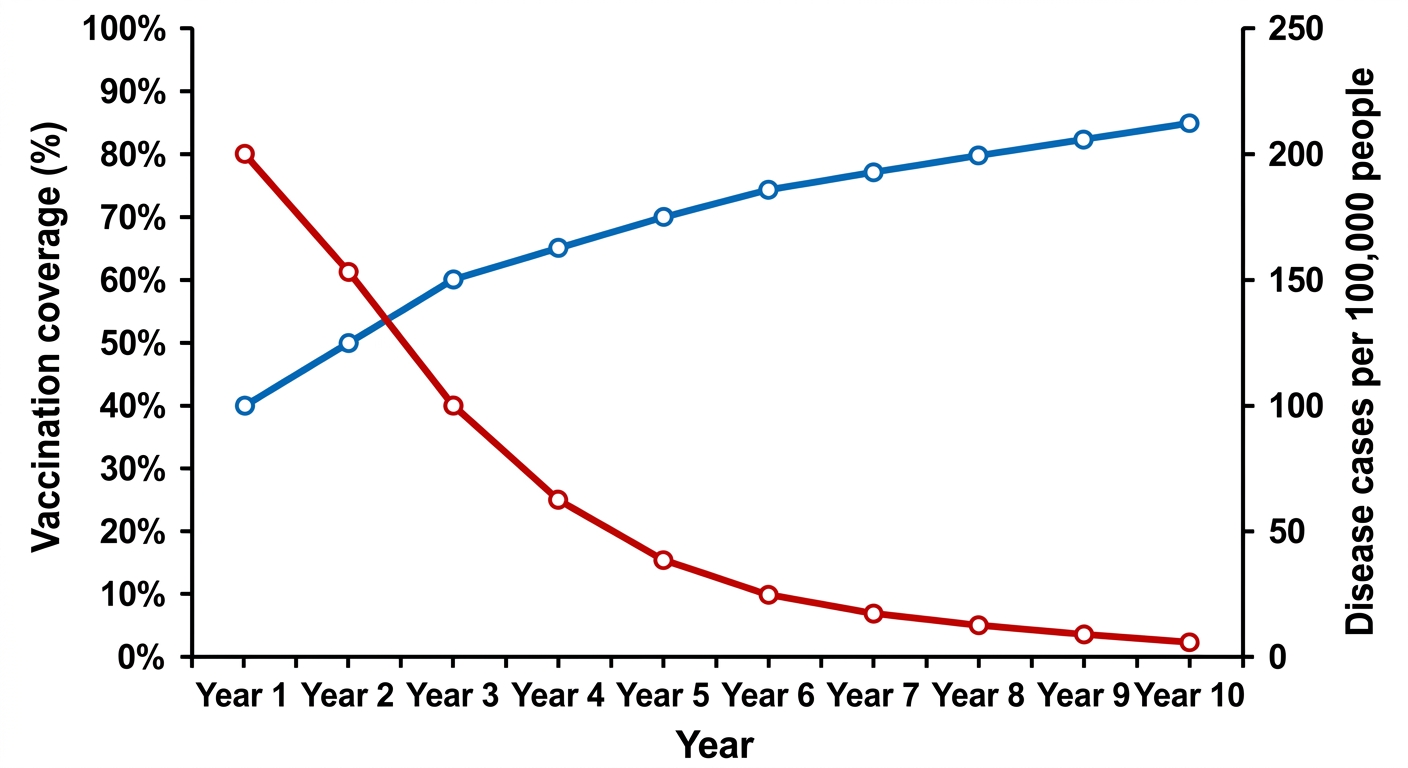
The graph below shows vaccination coverage (percent) and disease incidence (cases per 100,000 people) recorded annually over ten years for a single disease.
| Year | 1 | 2 | 3 | 4 | 5 | 6 | 7 | 8 | 9 | 10 |
|---|---|---|---|---|---|---|---|---|---|---|
| Vaccination coverage (percent) | 40 | 45 | 50 | 55 | 60 | 65 | 70 | 75 | 80 | 85 |
| Disease cases per 100,000 | 200 | 180 | 150 | 120 | 90 | 60 | 35 | 20 | 10 | 5 |
a
Identify the relationship between vaccination coverage and disease incidence shown in the graph, using data to support your answer. [1]
b
Explain how increasing the proportion of vaccinated individuals in a population reduces disease incidence. [1]
c
Discuss how the pattern of decline in disease cases supports the concept of herd immunity, with reference to a threshold effect visible in the data. [1]
Solutions
4QuestionHerd Immunity and Disease PreventionAssessment Practice
3 marks~5 minCriterion A
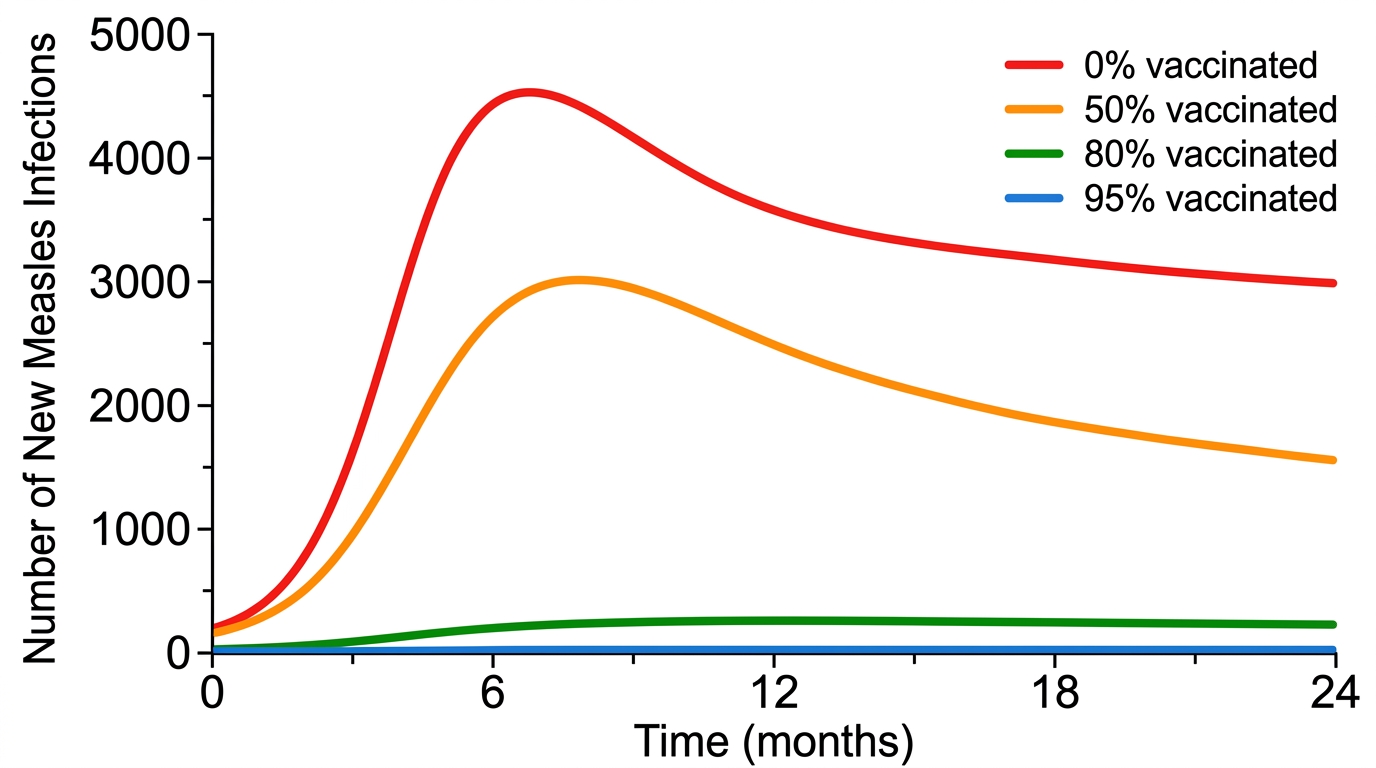
The graph below shows the number of new measles infections over time in a constant-sized population, at vaccination coverages of 50%, 75%, 90%, and 95%.
a
State the relationship between the percentage of vaccinated individuals and the number of new infections shown in the graph. [1]
b
Explain how increasing vaccination coverage reduces the transmission of measles through a population. [1]
c
Identify the vaccination coverage at which herd immunity is achieved for measles and justify why this threshold is higher than for most other infectious diseases. [1]
Solutions
5QuestionTypes of Vaccines (Examples of vaccines)Assessment Practice
8 marks~12 minCriterion D
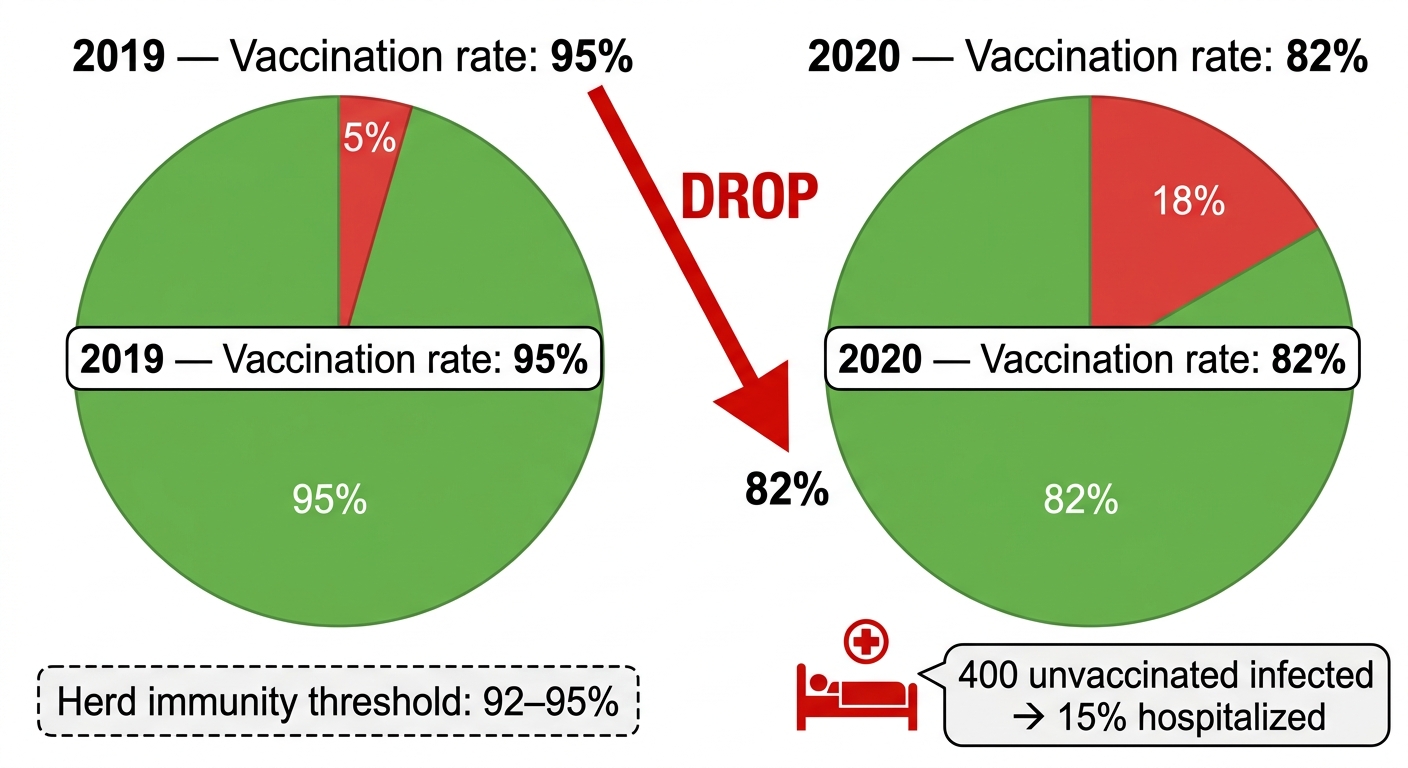
In 2019, a community of 10,000 people had a measles vaccination rate of 95%. Following the spread of misinformation, the rate dropped to 82% the following year. The herd immunity threshold for measles is 92–95%. In the subsequent outbreak, 400 unvaccinated individuals contracted measles; 15% of those required hospitalisation.
a
Explain how herd immunity protects a population, and why the drop from 95% to 82% vaccination coverage triggered a measles outbreak. [2]
b
Calculate the number of individuals hospitalised during the outbreak. Discuss two societal consequences of this level of disease burden on the affected community. [3]
c
Evaluate the limitations of relying solely on individual choice to maintain vaccination coverage, and justify one specific public health measure that could have prevented this outbreak. [3]
Solutions
That's every free question here — 5 of 64.
+59 more questions, plus Mock Papers & Worksheets, are waiting in Premium.