You're viewing free preview questions — 4 questions previewing here — subscribe to unlock 70 more, plus the Full Question Bank, Mock Papers & Worksheets.Upgrade
pH Scale and Indicators — Free MYP4 Chemistry Practice Questions

1QuestionUsing Litmus Universal and Natural IndicatorsConcept Practice
2 marks~3 minCriterion A
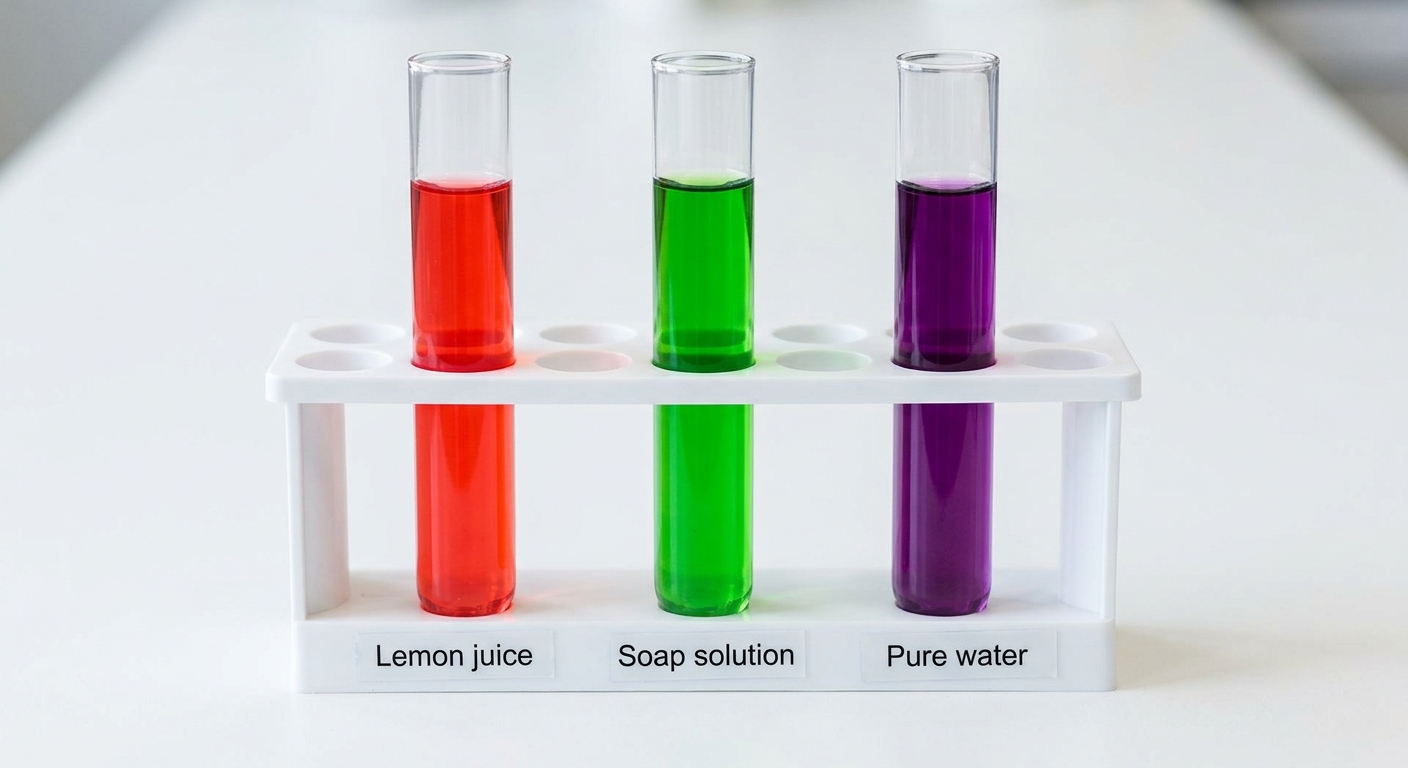
A student investigates natural indicators by adding red cabbage juice to three test tubes.
Test tube 1: lemon juice → turns red
Test tube 2: soap solution → turns green
Test tube 3: pure water → turns purple
Test tube 1: lemon juice → turns red
Test tube 2: soap solution → turns green
Test tube 3: pure water → turns purple
a
Identify which test tube contains an acid. [1]
b
Explain how the colour change in that test tube confirms the solution is acidic. [1]

Solutions
2QuestionUnderstanding the pH Scale 0 to 14Assessment Practice
5 marks~8 minCriterion C
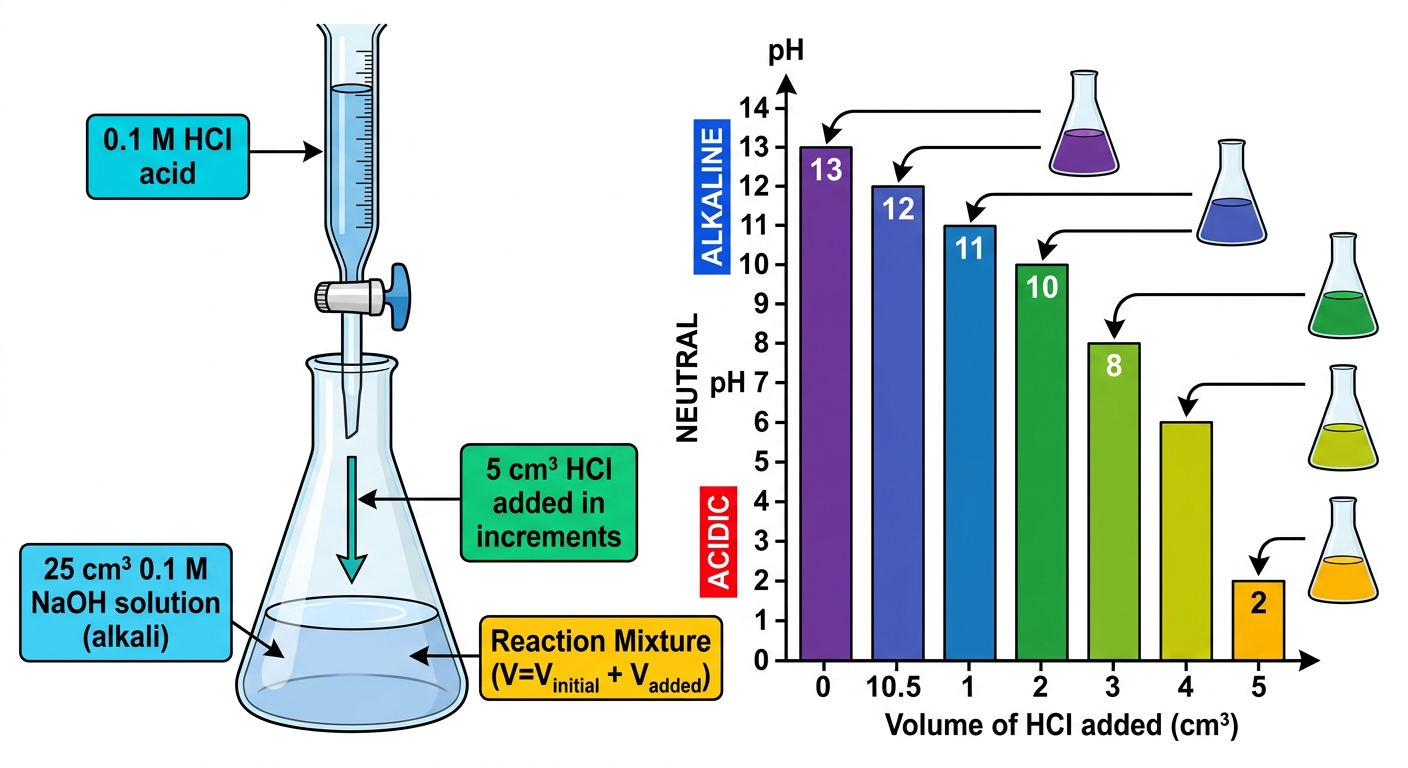
A student hypothesises that "adding any acid to an alkali immediately produces a neutral solution at pH 7." To test this, they add solution (0.1 mol dm) in 1 cm increments to 25 cm of solution (0.1 mol dm), recording pH after each addition.
| Volume of added (cm) | 0 | 1 | 2 | 3 | 4 | 5 |
|---|---|---|---|---|---|---|
| pH | 13 | 12 | 11 | 10 | 8 | 2 |
a
State the chemical equation for the reaction occurring during this experiment. [1]
b
Analyse the pH data to describe the trend observed as is added to the solution. [2]
c
Evaluate whether the experimental evidence supports or refutes the student's hypothesis, justifying your answer with reference to the stoichiometry of the reaction. [2]
Solutions
3QuestionEveryday Substances and Their pH ValuesAssessment Practice
6 marks~9 minCriterion D
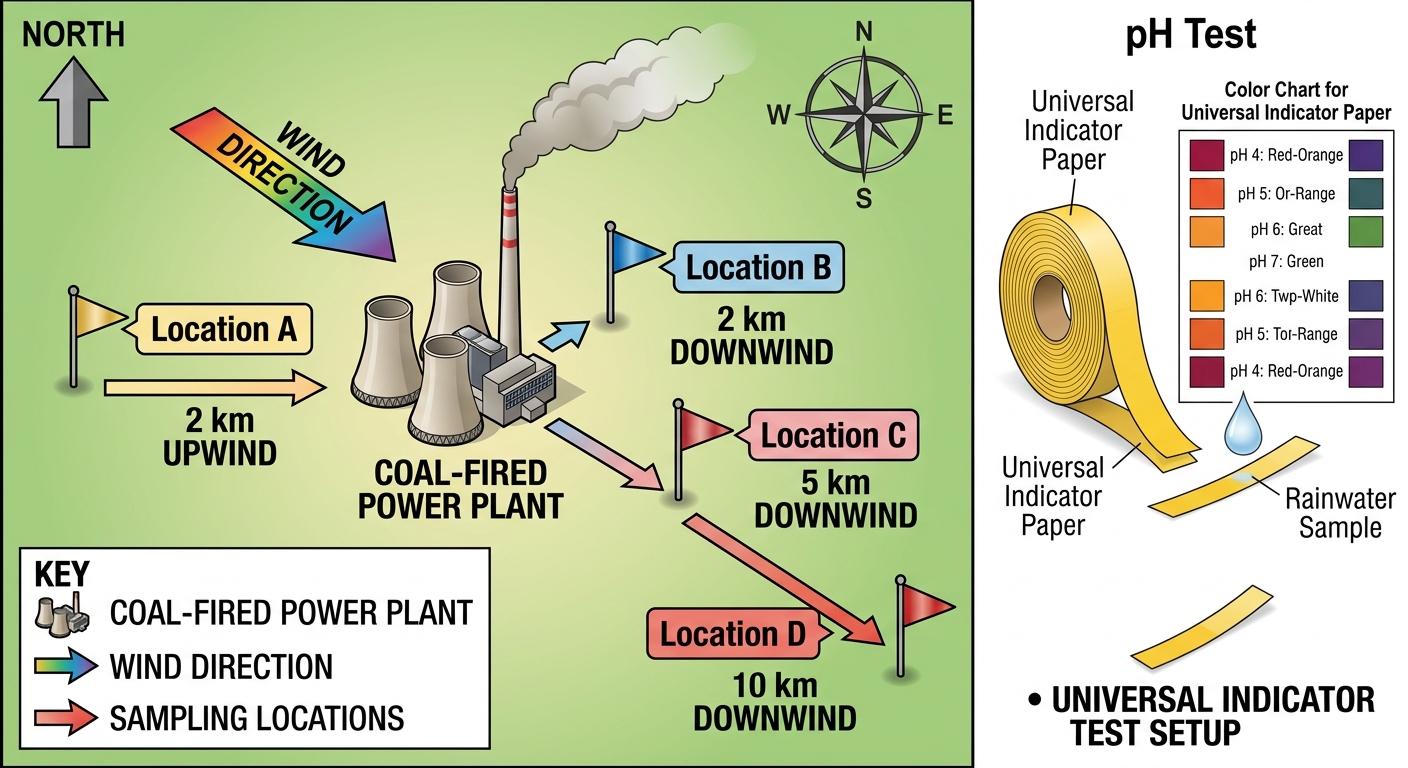
Rainwater pH was measured over one month at four locations near a coal-fired power plant. Average pH values are recorded below.
Location A (2 km upwind): 5.6
Location B (2 km downwind): 4.2
Location C (5 km downwind): 4.8
Location D (10 km downwind): 5.3
Pure rainwater has a natural pH of approximately 5.6 due to dissolved .
Location A (2 km upwind): 5.6
Location B (2 km downwind): 4.2
Location C (5 km downwind): 4.8
Location D (10 km downwind): 5.3
Pure rainwater has a natural pH of approximately 5.6 due to dissolved .
a
Describe the trend in pH with increasing distance downwind from the power plant. [1]
b
Explain how emissions from the power plant cause the pH values at locations B and C to be lower than at location A. [2]
c
A student measures the pH of a rainwater sample from location B using universal indicator paper and records pH 4.0. Analyse the reliability of this measurement, and justify whether it is sufficient for use in an environmental monitoring report. [3]
Solutions
4QuestionEveryday Substances and Their pH ValuesAssessment Practice
3 marks~5 minCriterion B
The pH values of six household substances are listed below.
| Substance | pH value |
|---|---|
| Lemon juice | 2.5 |
| Vinegar | 3.0 |
| Milk | 6.5 |
| Pure water | 7.0 |
| Baking soda solution | 8.5 |
| Soap solution | 10.0 |
a
Identify the neutral substance from the list. [1]
b
Classify each remaining substance as acidic or basic, using its pH value as evidence. [1]
c
Analyse how the data shows a trend in acidity and alkalinity across the six substances, and explain what this trend reveals about the relationship between pH and the strength of acidity or alkalinity. [1]
Solutions
That's every free question here — 4 of 74.
+70 more questions, plus Mock Papers & Worksheets, are waiting in Premium.