You're viewing free preview questions — 4 questions previewing here — subscribe to unlock 79 more, plus the Full Question Bank, Mock Papers & Worksheets.Upgrade
Ozone Layer and CFCs — Free MYP4 Chemistry Practice Questions

1QuestionUV radiation and its harmful effectsConcept Practice
2 marks~3 minCriterion A
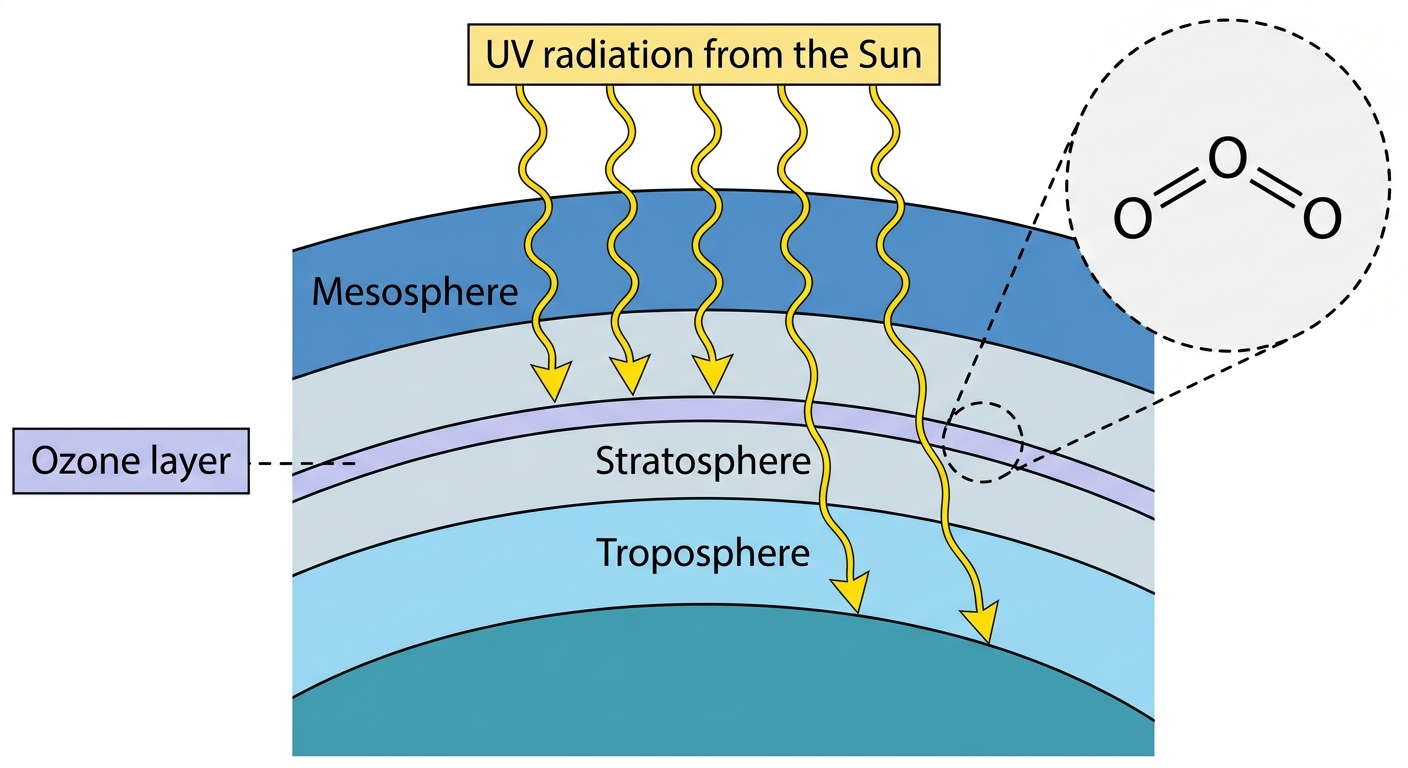
The diagram below shows the ozone layer absorbing incoming ultraviolet (UV) radiation from the Sun. A magnified circle highlights a single molecule of ozone.
a
Identify the molecule shown in the magnified circle, giving its chemical formula. [1]
b
Explain one harmful effect of UV radiation on human health. [1]

Solutions
2QuestionInternational agreements (e.g., Montreal Protocol)Assessment Practice
2 marks~3 minCriterion D
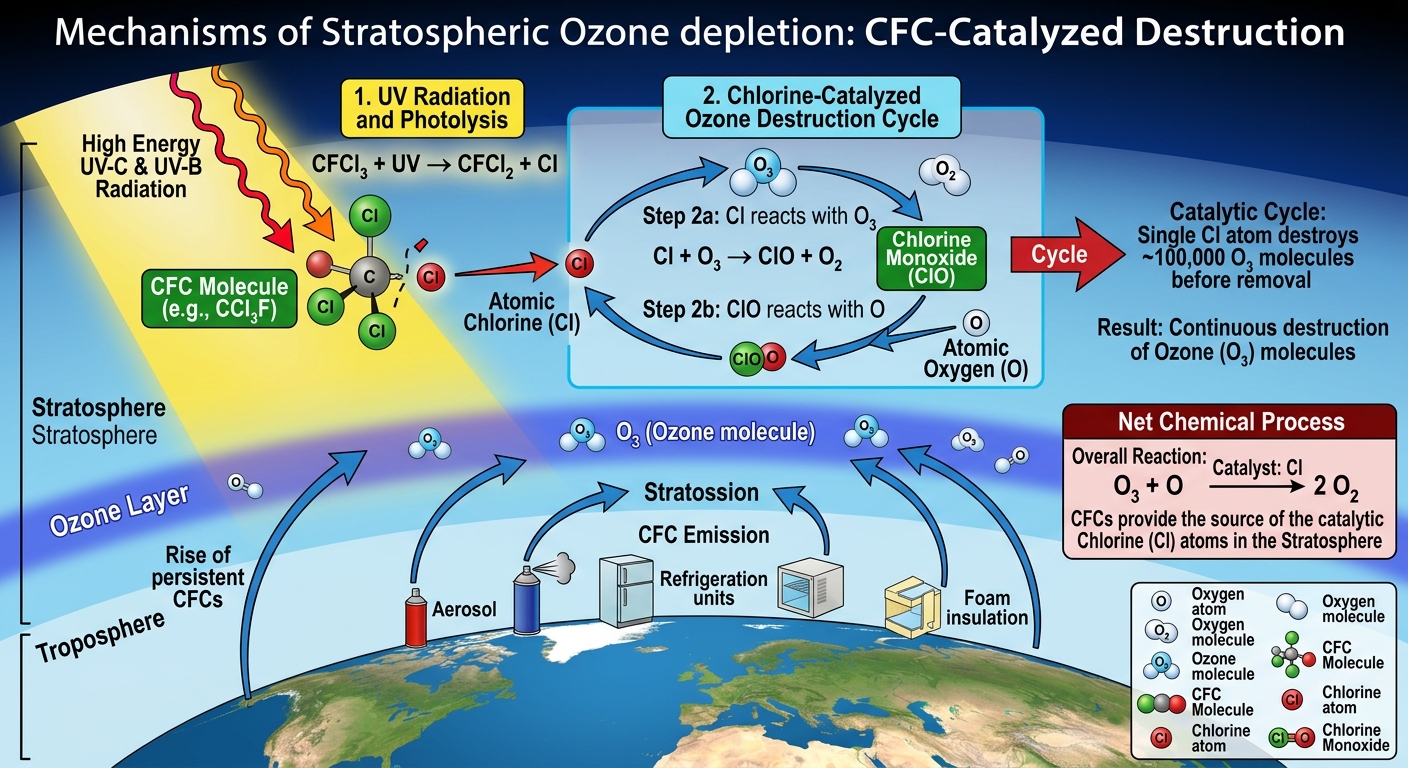
The Montreal Protocol (1987) is an international agreement that phased out the production and use of chlorofluorocarbons (CFCs).
a
Explain how banning CFCs under the Montreal Protocol reduces ozone depletion in the stratosphere. [1]
b
Identify one limitation that reduces the effectiveness of the Montreal Protocol in protecting the ozone layer. [1]
Solutions
3QuestionOzone hole formation (especially over Antarctica)Assessment Practice
5 marks~8 minCriterion C
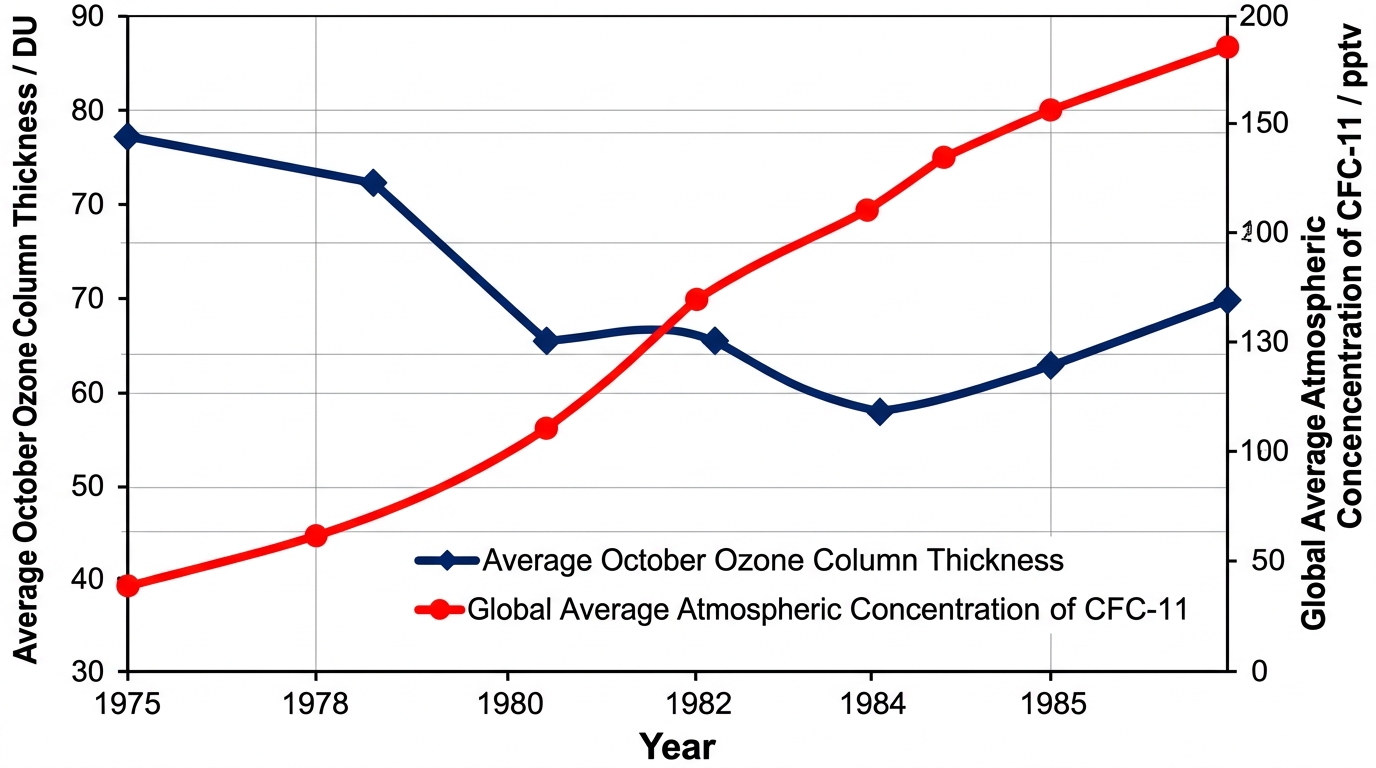
The table below shows the average October ozone column thickness (in Dobson Units, DU) over Halley Bay, Antarctica, and the global average atmospheric concentration of CFC-11 (in parts per trillion by volume, pptv) for selected years.
| Year | 1975 | 1978 | 1980 | 1982 | 1984 | 1985 |
|---|---|---|---|---|---|---|
| Ozone column (DU) | 290 | 270 | 250 | 220 | 200 | 180 |
| CFC-11 (pptv) | 120 | 140 | 160 | 185 | 210 | 225 |
a
Describe the trend in each dataset between 1975 and 1985. [1]
b
Identify the correlation between ozone column thickness and CFC-11 concentration, and explain how this relationship is consistent with the catalytic destruction of ozone by chlorine radicals. [2]
c
Evaluate the strength of this dataset as evidence for the hypothesis that CFCs cause ozone depletion. [2]
Solutions
4QuestionUV radiation and its harmful effectsAssessment Practice
6 marks~9 minCriterion B
Ground-level UV-B intensity was measured at five sites with different ozone column thicknesses on the same day under clear-sky conditions.
| Ozone thickness (DU) | 200 | 250 | 300 | 350 | 400 |
|---|---|---|---|---|---|
| UV-B intensity (W m) | 2.5 | 1.9 | 2.1 | 1.1 | 0.7 |
a
Describe the general trend between ozone column thickness and UV-B intensity shown in the data. [2]
b
Identify the data point that does not fit the general trend and deduce what UV-B intensity value would be expected at that ozone thickness. [2]
c
Explain why the anomalous data point is physically impossible, with reference to how ozone absorbs UV-B radiation. [2]
Solutions
That's every free question here — 4 of 83.
+79 more questions, plus Mock Papers & Worksheets, are waiting in Premium.