You're viewing free preview questions — 4 questions previewing here — subscribe to unlock 160 more, plus the Full Question Bank, Mock Papers & Worksheets.Upgrade
Linear Functions — Free MYP4 Mathematics (Extended) Practice Questions

1QuestionGraphing linesConcept Practice
4 marks~6 minCriterion A
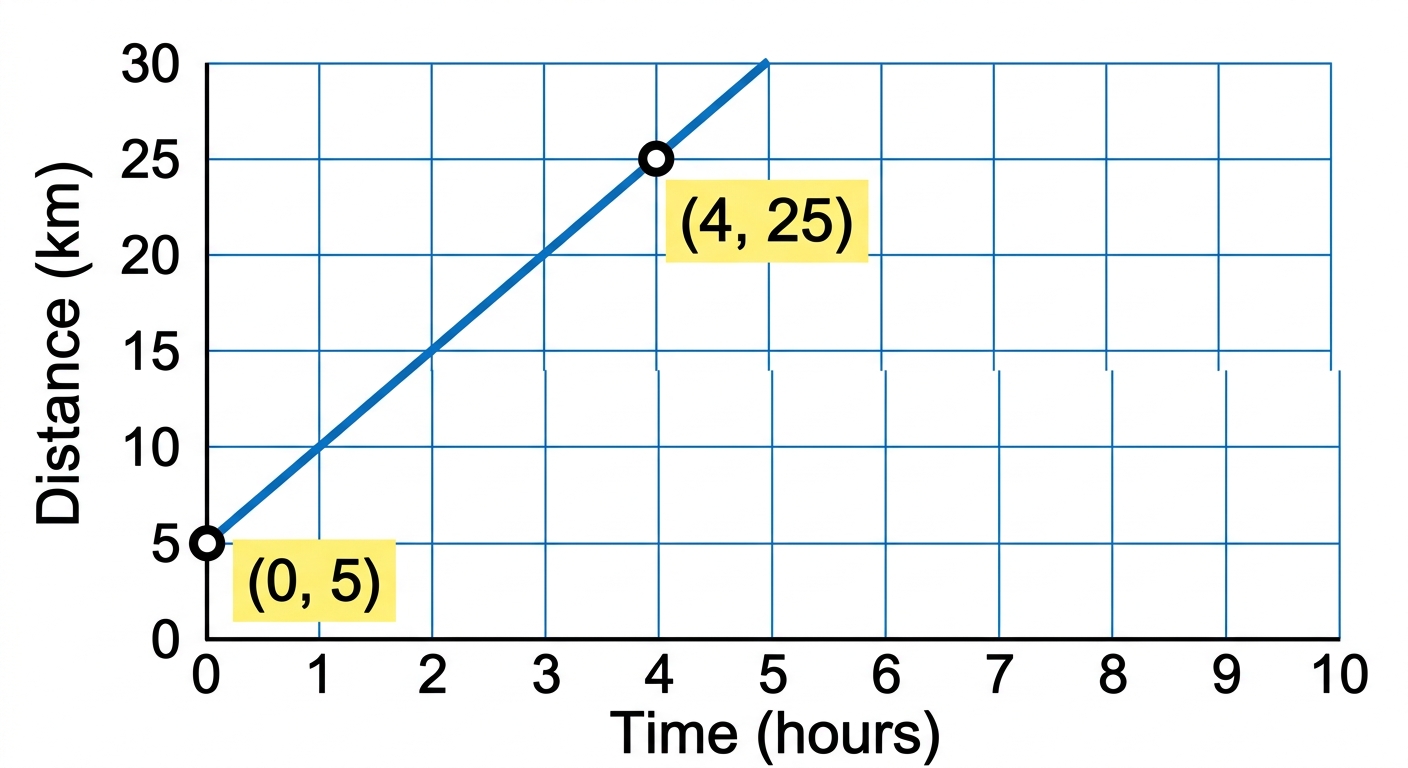
A cyclist begins a journey already some distance from the start of a measured route. The graph of the journey is a straight line passing through and , where the -axis represents time in hours and the -axis represents distance from the route's start in kilometres.
a
Calculate the slope of the line and state what it represents in this context. [1]
b
Deduce the equation of the line in the form . [1]
c
The cyclist's destination is 42 km from the route's start. Using your equation, justify whether the cyclist reaches the destination within 7 hours. [2]

Solutions
2QuestionGraphing linesAssessment Practice
4 marks~6 minCriterion D
A city planner uses the linear model to predict monthly water usage (in megalitres) for a suburb with population (in thousands). Actual usage data for five suburbs is given below.
| Suburb A | actual ML | |
|---|---|---|
| Suburb B | actual ML | |
| Suburb C | actual ML | |
| Suburb D | actual ML | |
| Suburb E | actual ML |
a
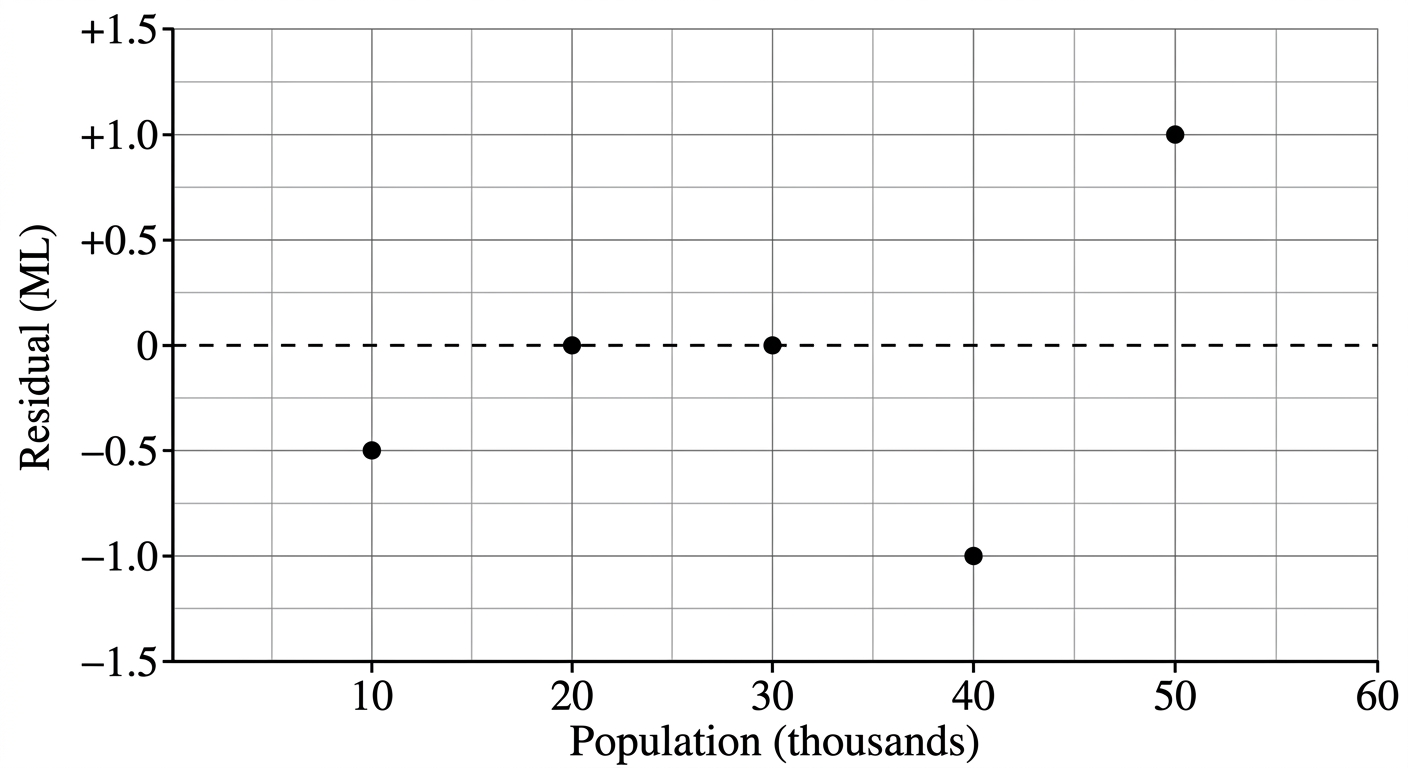
Calculate the residual (actual predicted) for each suburb. [2]
b
Construct a residual plot with population on the horizontal axis. Describe the pattern you observe. [1]
c
The city planner proposes using this model to set water budgets for all suburbs. Advise the city planner whether this model is sufficient for budget-setting, using your residuals and at least one real-world factor the model ignores. [1]
Solutions
3QuestionSlopeConcept Practice
4 marks~6 minCriterion B
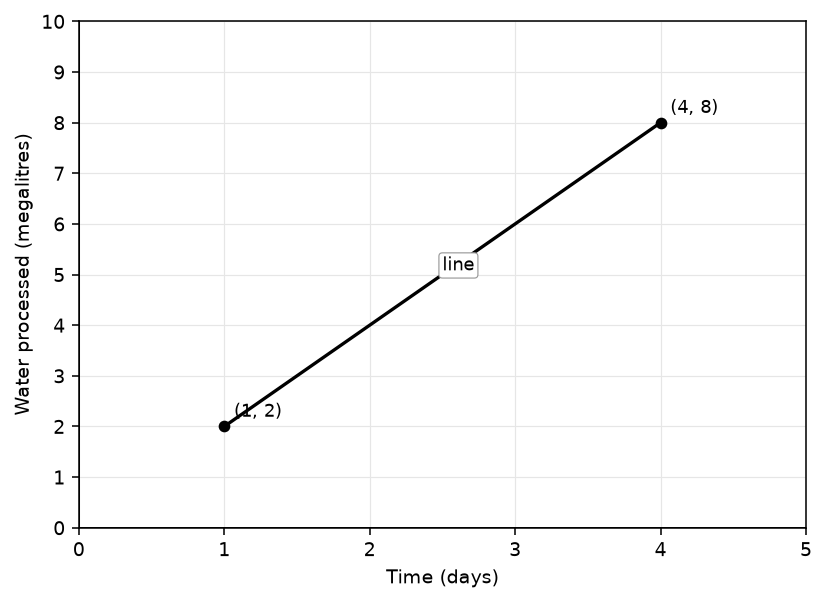
A city's water authority monitors daily water usage at a treatment plant. The graph shows total water processed (in megalitres) against time (in days), modelled as a straight line passing through the labelled points and .
a
Calculate the slope of the line using the two labelled points. [1]
b
Show that the slope is constant by calculating the rise and run between a different pair of points on the line. [2]
c
The authority states: "Usage is increasing at a steady rate, so we can reliably forecast demand using this model." Assess whether the mathematical properties of the graph support this statement. [1]
Solutions
4QuestionSlope-intercept formAssessment Practice
4 marks~6 minCriterion C
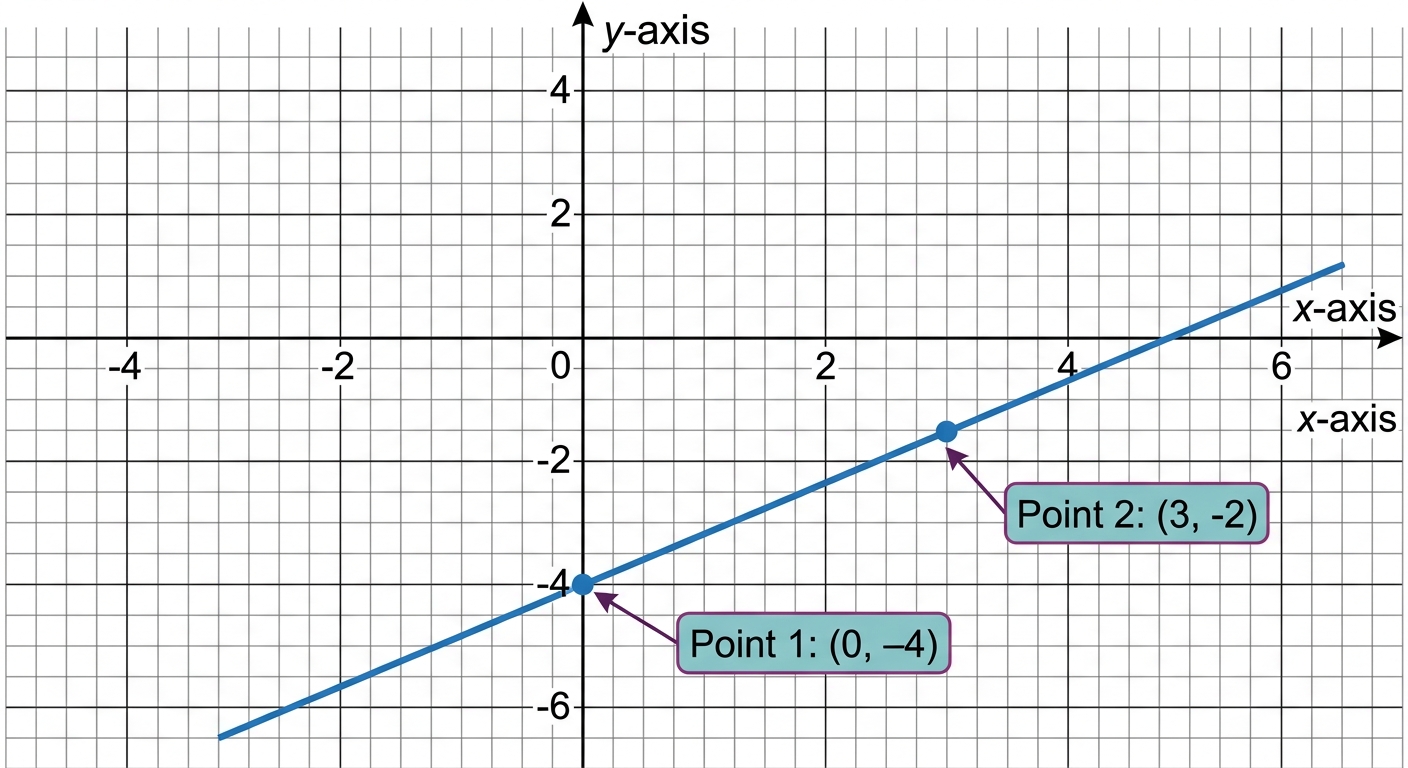
A mobile data plan charges a fixed monthly fee plus a constant rate per gigabyte used. The total cost, in dollars, is modelled by a linear function. The graph passes through and .
a
Calculate the slope of the line using the two given points. [1]
b
Deduce the equation of the line in slope-intercept form . [1]
c
A technician claims the monthly fixed fee is a cost saving of 4 dollars. Justify whether this claim accurately describes the overall pricing structure of the plan. [2]
Solutions
That's every free question here — 4 of 164.
+160 more questions, plus Mock Papers & Worksheets, are waiting in Premium.