You're viewing free preview questions — 4 questions previewing here — subscribe to unlock 44 more, plus the Full Question Bank, Mock Papers & Worksheets.Upgrade
Graphing Quadratic Cubic and Exponential Functions — Free MYP4 Mathematics (Extended) Practice Questions

1QuestionGraphing Simple Cubic FunctionsConcept Practice
2 marks~3 minCriterion A
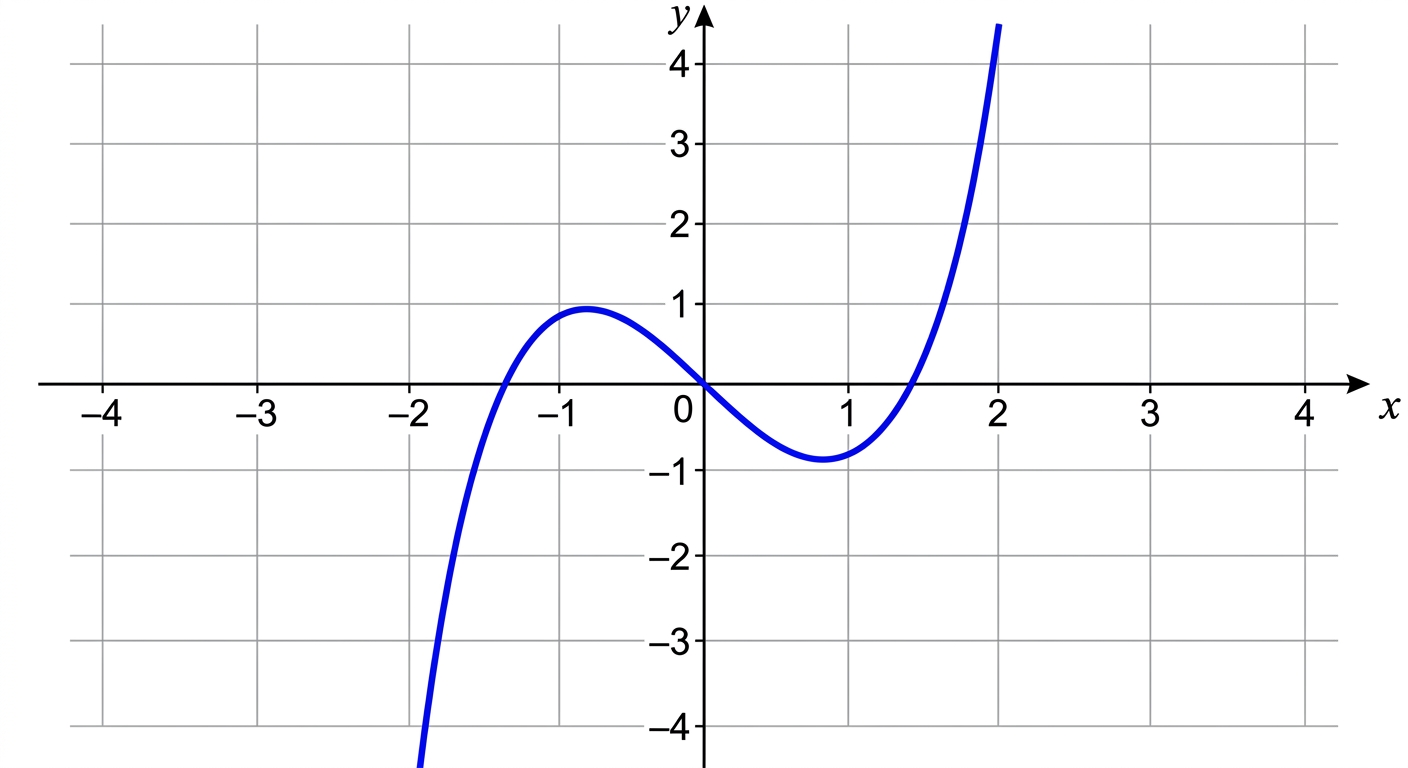
An engineer models the vibration of a bridge cable using the cubic function , where represents time (seconds) and represents displacement (metres) from equilibrium. The graph of this function is shown below.
State the number of -intercepts of the graph and the coordinates of the -intercept. [2]
State the number of -intercepts of the graph and the coordinates of the -intercept. [2]

Solutions
2QuestionGraphing and Identifying Exponential Growth and DecayAssessment Practice
4 marks~6 minCriterion D
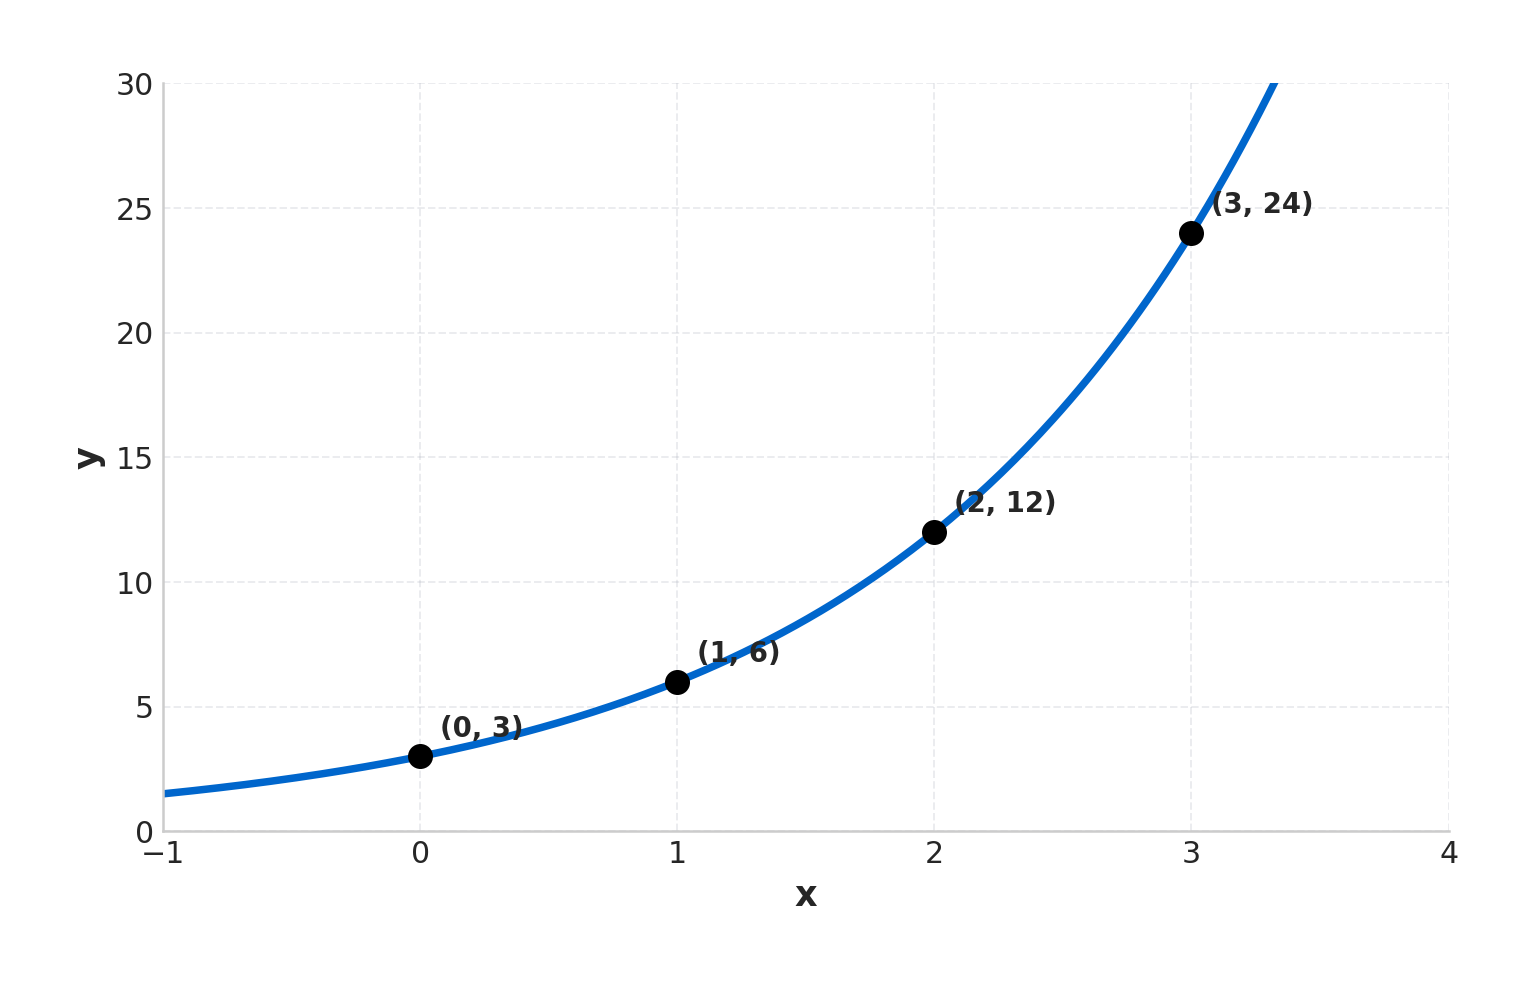
A wildlife reserve monitors a rare beetle species over four consecutive years. The population is modelled by an exponential function. The graph shows population (in hundreds) against time (in years), with points , , , and plotted and labelled.
a
State the initial population of beetles and deduce the growth factor. [2]
b
Write the equation of the exponential model in the form . [1]
c
The reserve can sustainably support a maximum of 5000 beetles. Justify whether the reserve manager must intervene before year . [1]
Solutions
3QuestionGraphing Simple Cubic FunctionsConcept Practice
4 marks~6 minCriterion D
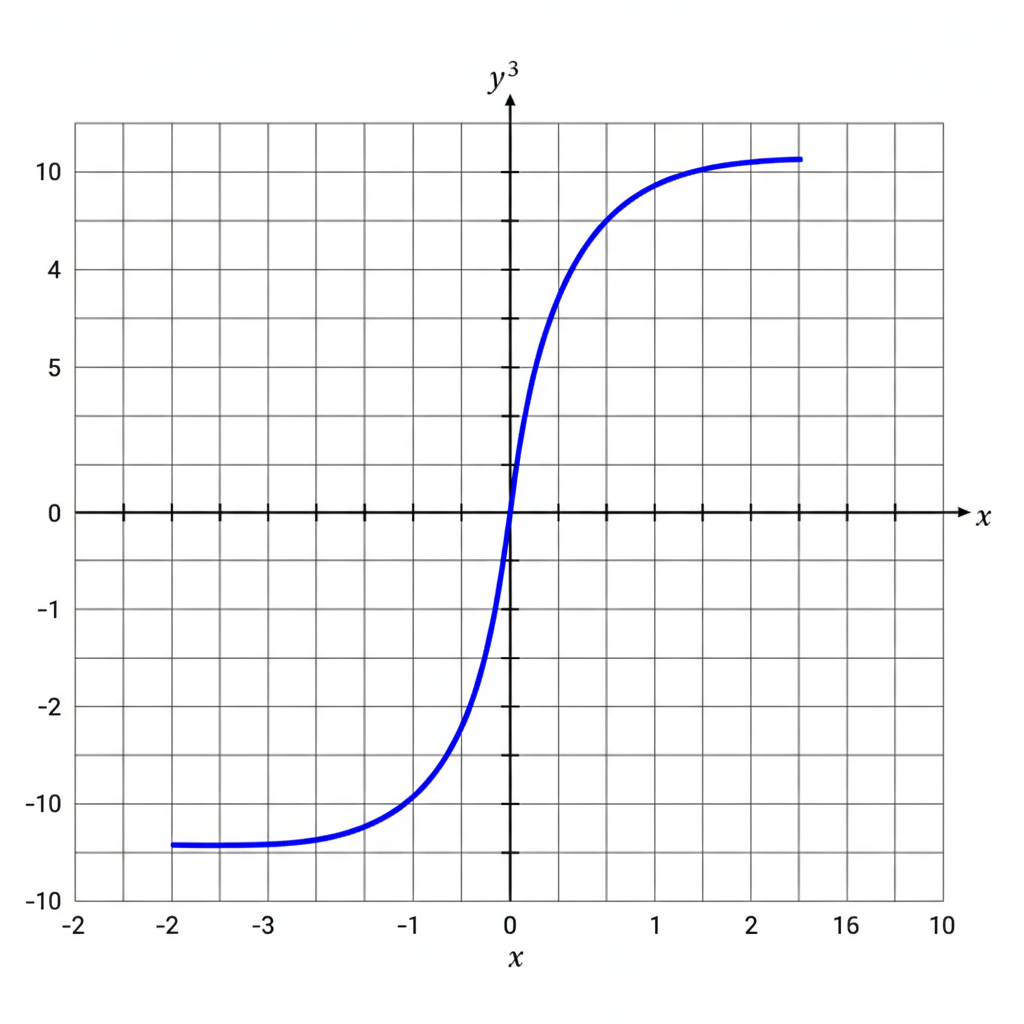
A water storage tank is designed so that its volume (in litres) relates to a single length measurement (in metres) by .
The graph of is shown below.
The graph of is shown below.
a
State the coordinates of any intercepts of and describe its end behaviour using the notation . [2]
b
The tank must hold at least 8000 litres. Using the graph of , justify whether metres meets this design requirement. [2]
Solutions
4QuestionGraphing Simple Cubic FunctionsAssessment Practice
6 marks~9 minCriterion B
A packaging engineer models container volume using , where is the side length in centimetres and is the volume in cm³. A second design scales volume by a factor of 2, modelled by .
:
:
:
:
:
:
a
Explain how the -values of relate to those of , identifying the pattern shown in the table. [2]
b
Deduce the -values of at and , using the pattern from part (a) rather than direct calculation. [2]
c
A third design requires a volume output of at least 150 cm³ when . The engineer proposes with . Advise the engineer whether is sufficient and state the minimum integer value of that meets the requirement. [2]
Solutions
That's every free question here — 4 of 48.
+44 more questions, plus Mock Papers & Worksheets, are waiting in Premium.