You're viewing free preview questions — 4 questions previewing here — subscribe to unlock 70 more, plus the Full Question Bank, Mock Papers & Worksheets.Upgrade
Box Plots, Histograms and Cumulative Frequency 1 — Free MYP4 Mathematics (Extended) Practice Questions

1QuestionConstructing and Interpreting Box PlotsConcept Practice
2 marks~3 minCriterion A
A school uses box plots to compare class performance on a standardised mathematics test.
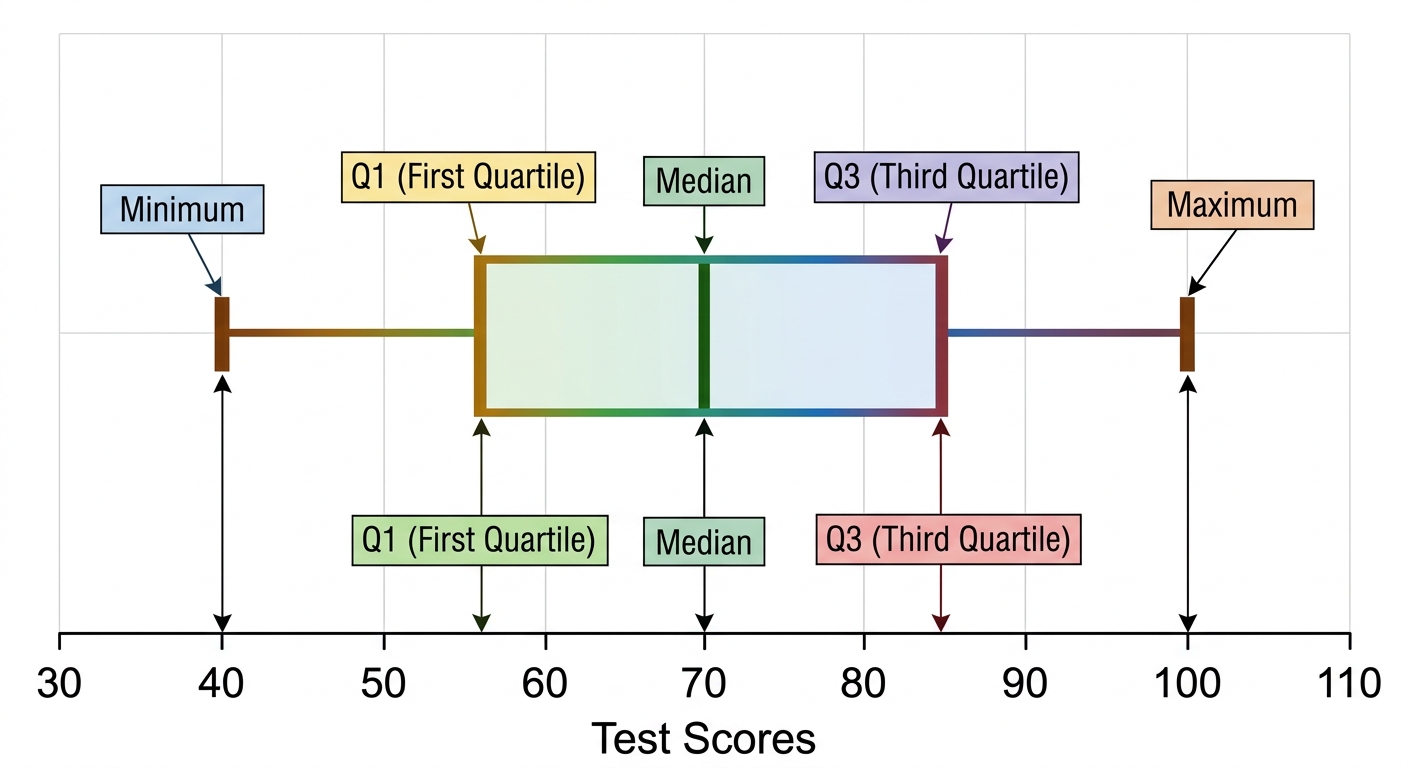
The five-number summary for Class 10B is:
Minimum , , Median , , Maximum .
The school's policy states that a class shows sufficient spread in the middle 50% of scores only if the IQR exceeds 25 marks.
The five-number summary for Class 10B is:
Minimum , , Median , , Maximum .
The school's policy states that a class shows sufficient spread in the middle 50% of scores only if the IQR exceeds 25 marks.
a
Calculate the interquartile range (IQR) for Class 10B. [1]
b
Justify whether Class 10B meets the school's policy for sufficient spread. [1]

Solutions
2QuestionConstructing and Interpreting Box PlotsAssessment Practice
4 marks~6 minCriterion C
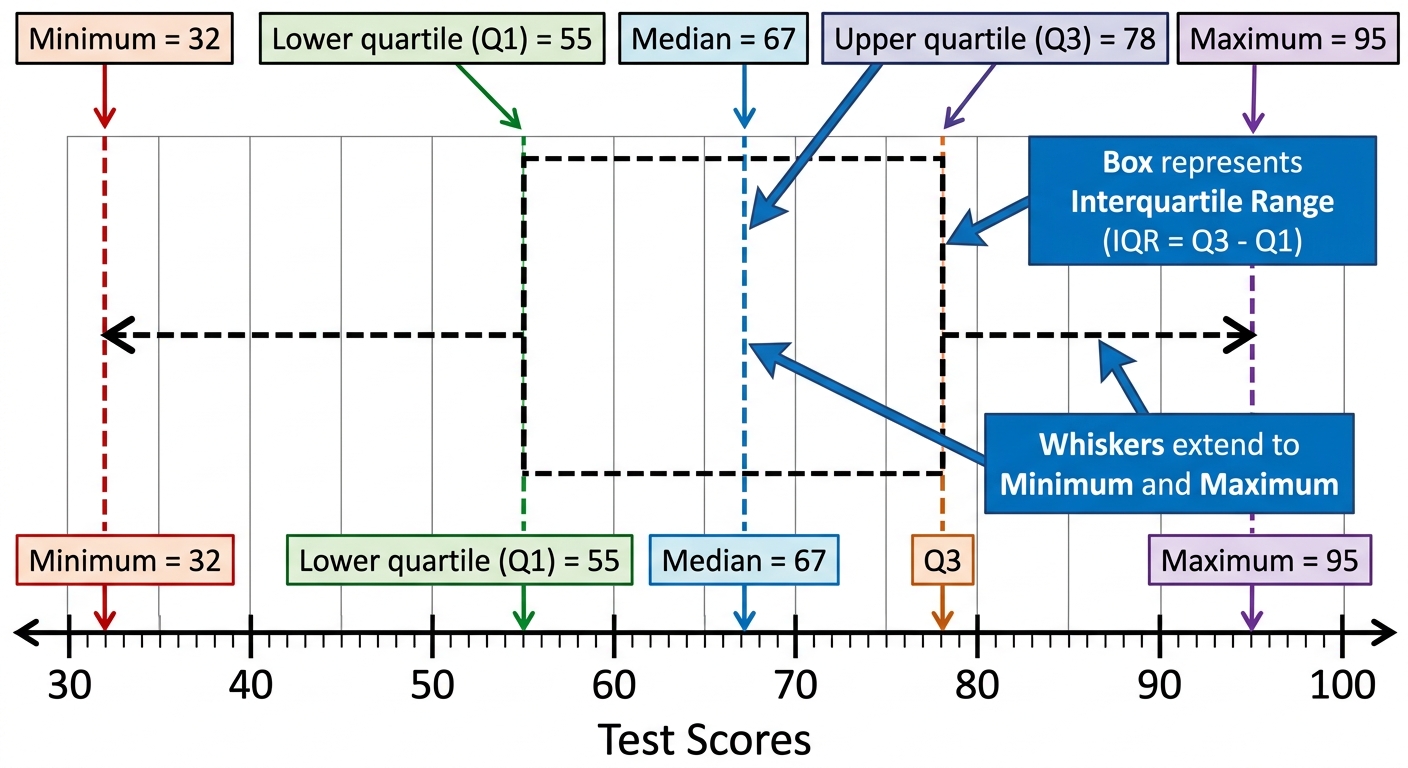
A school records the scores of 20 students on a mathematics test. The five-number summary is:
Minimum , , Median , , Maximum
Minimum , , Median , , Maximum
a
Construct a box plot for this data on a number line from 30 to 100, clearly marking all five values. [2]
b
The school's pass threshold is the lower quartile. Justify whether the score distribution provides sufficient evidence that the majority of students passed. [2]
Solutions
3QuestionConstructing and Interpreting Box PlotsAssessment Practice
6 marks~9 minCriterion B
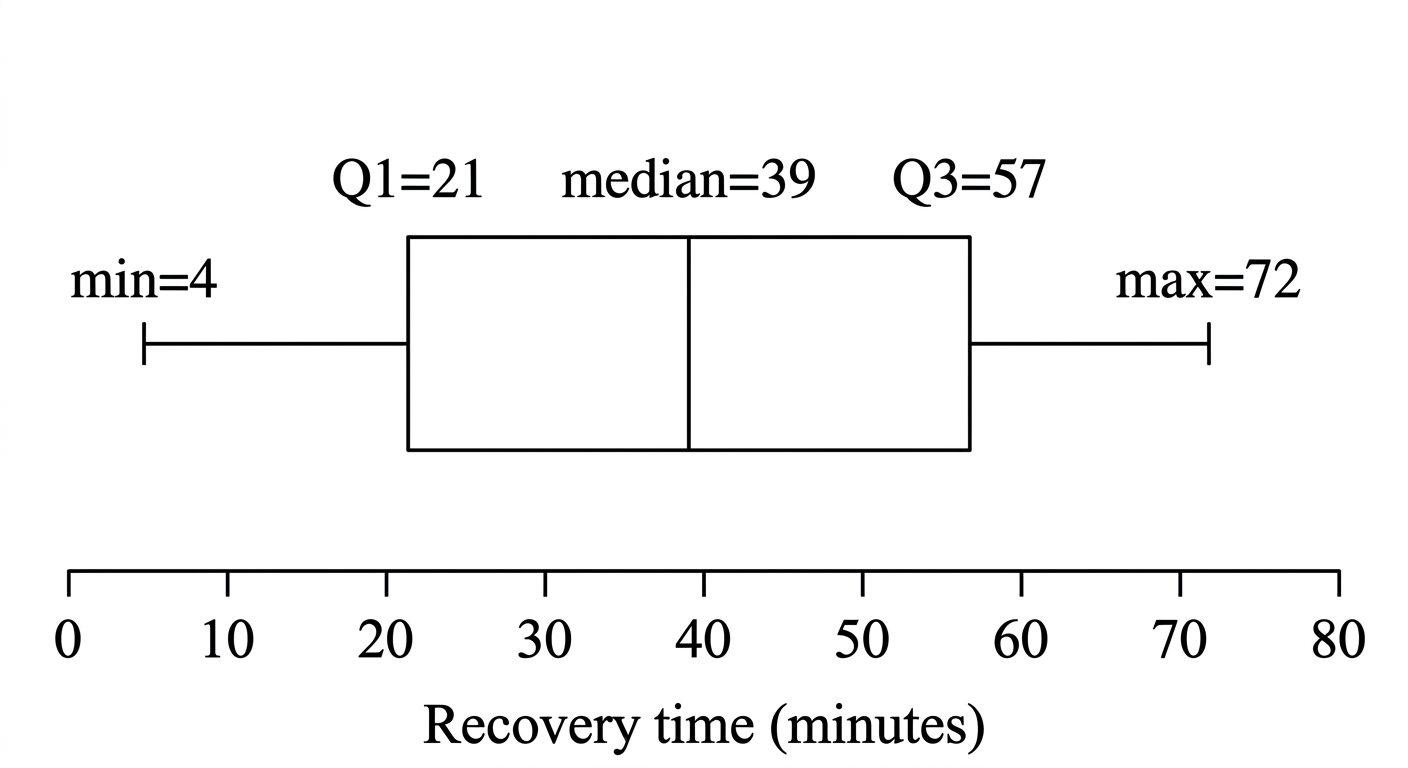
A sports analyst records the recovery times (in minutes) of 23 athletes after a training session. The ordered values are:
Quartile positions for datasets of size are given below.
: at position 2, median at position 4, at position 6
: at position 3, median at position 6, at position 9
: at position 4, median at position 8, at position 12
: at position 5, median at position 10, at position 15
Quartile positions for datasets of size are given below.
: at position 2, median at position 4, at position 6
: at position 3, median at position 6, at position 9
: at position 4, median at position 8, at position 12
: at position 5, median at position 10, at position 15
a
Deduce a general rule, in terms of , for the positions of the median, , and in an ordered dataset of values. [2]
b
Using your rules from part (a), construct the five-number summary for the 23 recovery times, showing all position calculations. [2]
c
The analyst claims that the middle 50% of athletes recover within a 36-minute window. Justify whether the interquartile range supports this claim. [2]
Solutions
4QuestionCumulative Frequency Graphs and CurvesAssessment Practice
6 marks~9 minCriterion D
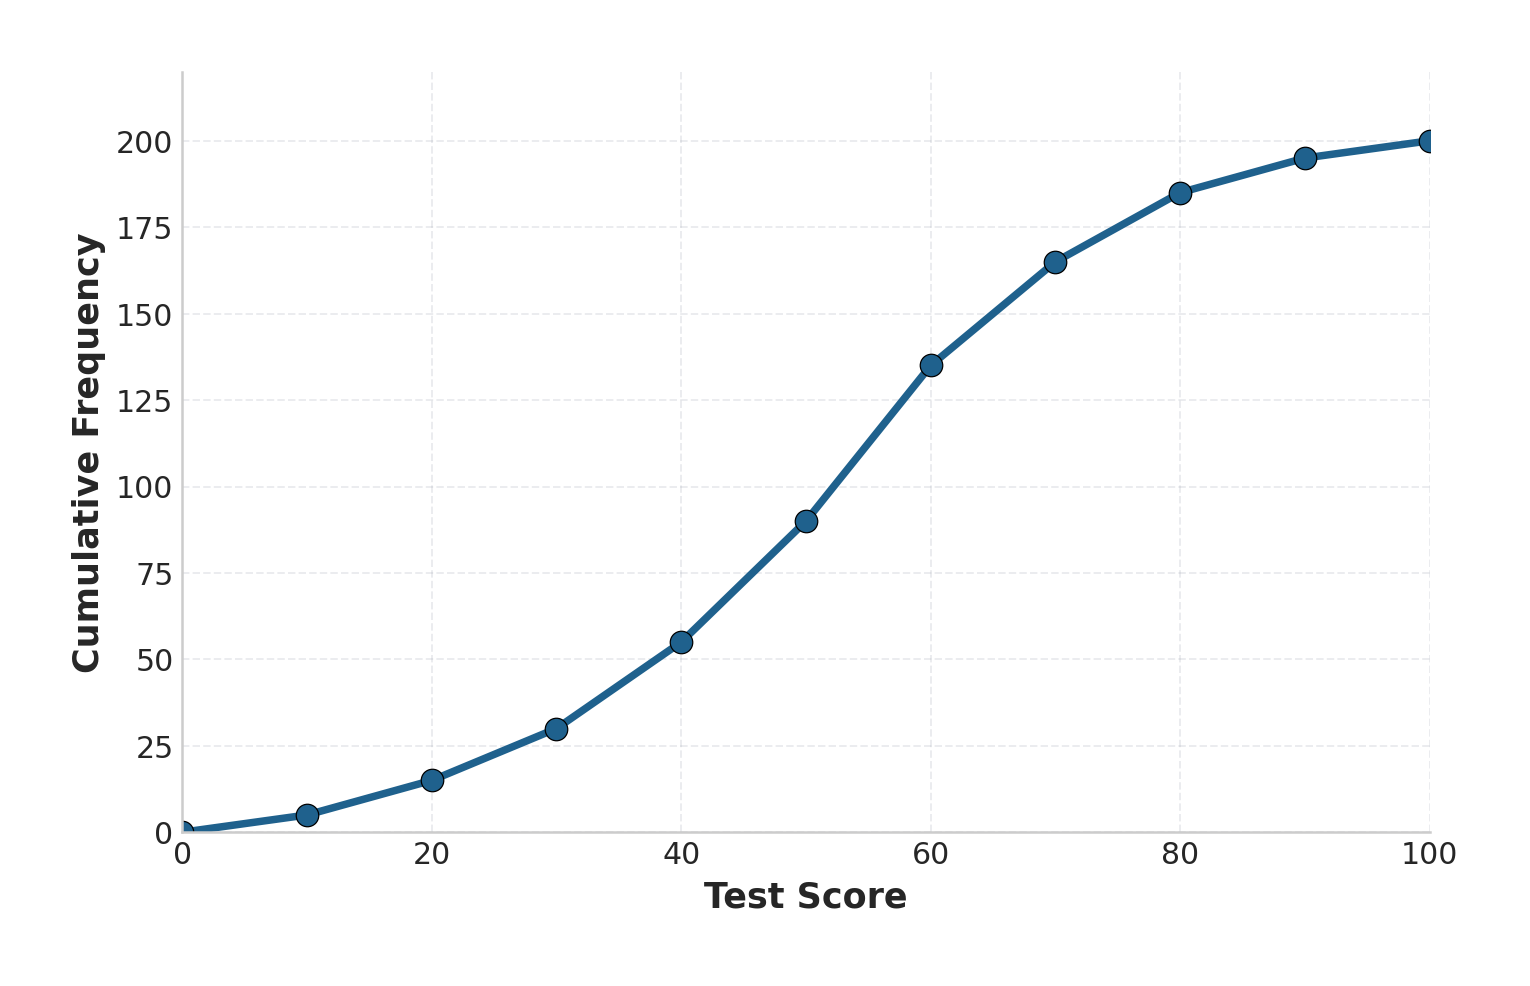
A cumulative frequency curve shows the mathematics exam scores of 200 students. Key points on the curve are given below.
A normal distribution model with mean 55 and standard deviation 15 predicts the following cumulative frequencies.
| Score | 40 | 55 | 70 |
|---|---|---|---|
| Cumulative frequency | 55 | 90 | 165 |
A normal distribution model with mean 55 and standard deviation 15 predicts the following cumulative frequencies.
| Score | 40 | 55 | 70 |
|---|---|---|---|
| Predicted cumulative frequency | 32 | 100 | 168 |
a
Calculate the percentage difference between the actual and predicted cumulative frequencies at a score of 40, using the formula
Give your answer to one decimal place. [2]
Give your answer to one decimal place. [2]
b
The percentage differences at scores 55 and 70 are 11.1% and 1.8% respectively. Analyse how the accuracy of the normal distribution model varies across the lower, middle, and upper ends of the score distribution. [2]
c
The school's assessment policy states that a model is considered reliable only if it produces a percentage difference below 20% at every key score. Advise the school whether the normal distribution model should be used to make decisions about student performance in this exam. [2]
Solutions
That's every free question here — 4 of 74.
+70 more questions, plus Mock Papers & Worksheets, are waiting in Premium.