You're viewing free preview questions — 4 questions previewing here — subscribe to unlock 115 more, plus the Full Question Bank, Mock Papers & Worksheets.Upgrade
Box Plots, Histograms and Cumulative Frequency 2 — Free MYP4 Mathematics (Extended) Practice Questions

1QuestionBox plots and quartilesConcept Practice
5 marks~8 minCriterion A
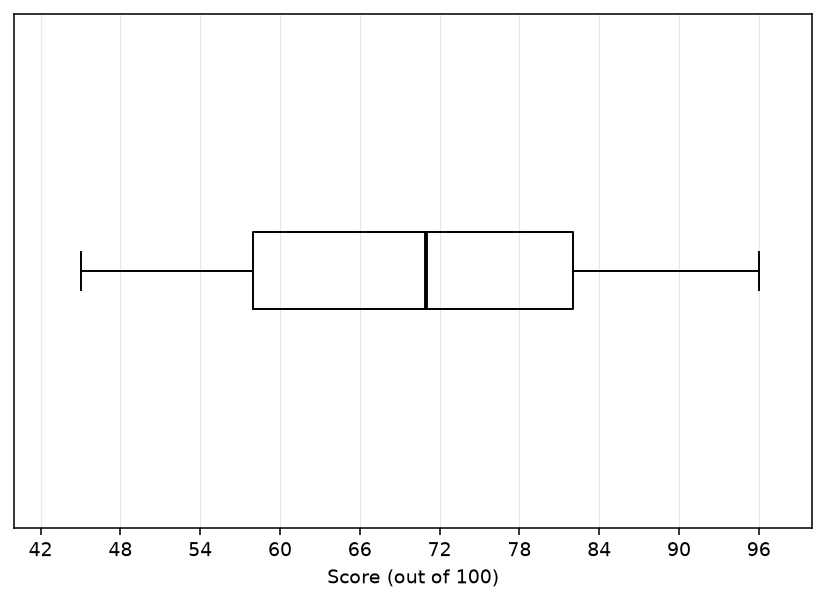
The box plot below shows the distribution of scores (out of 100) for 40 students on a mathematics test.
The five-number summary is: minimum , , median , , maximum .
The five-number summary is: minimum , , median , , maximum .
a
Write down the interquartile range (IQR) of the scores. [1]
b
A student is described as a "low performer" if their score falls below . Find the number of students in the class who are low performers. [2]
c
The teacher claims: "The majority of students scored above 71." Justify whether this claim is correct, using the definition of the median. [2]

Solutions
2QuestionQuartiles and percentiles (discrete and continuous data)Assessment Practice
8 marks~12 minCriterion D
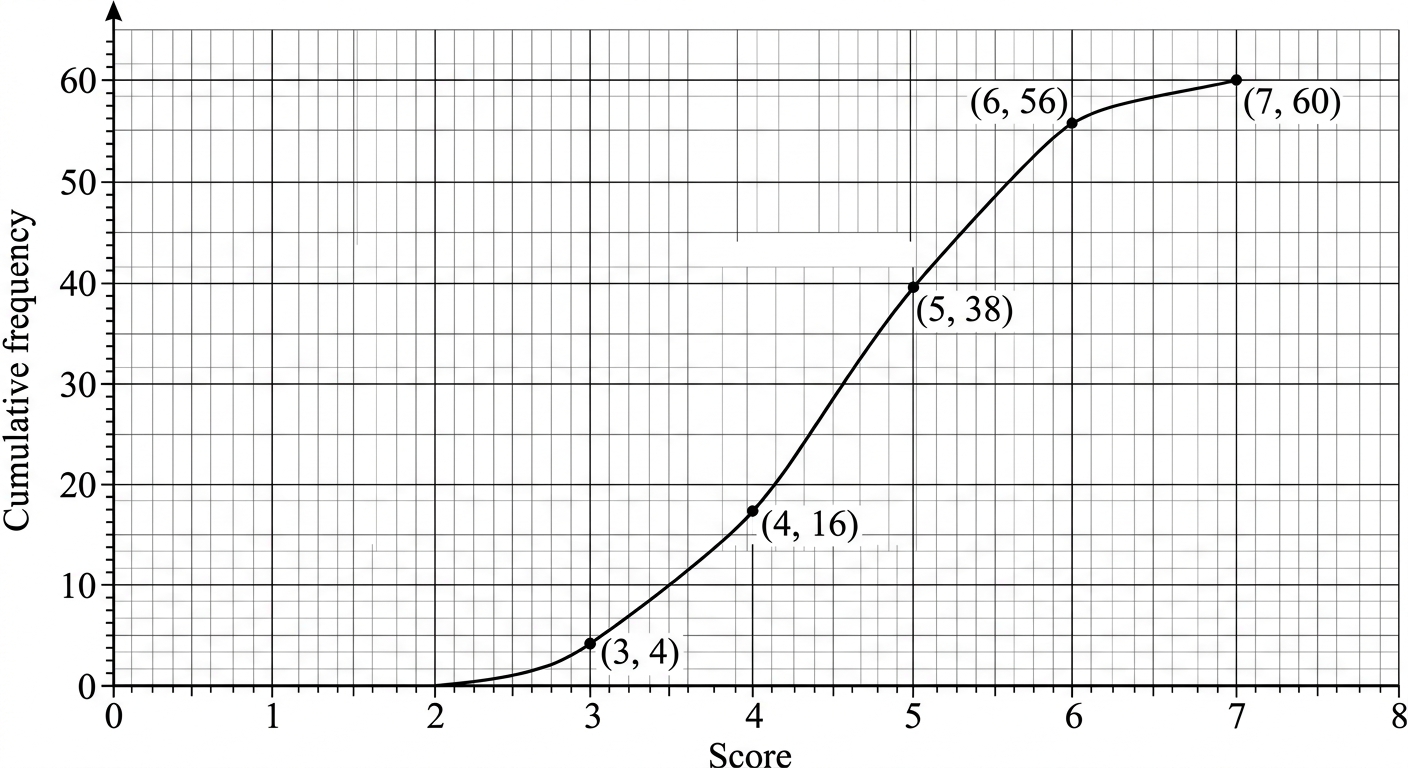
A school records the predicted IB Mathematics scores (on a scale of 1 to 7) for its 60 MYP 5 Extended students. The results are summarised in the cumulative frequency table below.
| Score | 3 | 4 | 5 | 6 | 7 |
|---|---|---|---|---|---|
| Cumulative frequency | 4 | 16 | 38 | 56 | 60 |
a
Calculate the percentile rank of a student whose predicted score is 6, giving your answer to one decimal place. [2]
b
A university requires applicants to have a predicted score at or above the 75th percentile of their school cohort. A second student scored 5. Determine, showing all working, whether this student meets the university's requirement. [3]
c
A third student argues that achieving a high percentile rank within this school guarantees a strong university application. Critique this argument, referring to at least two distinct mathematical or statistical reasons. [3]
Solutions
3QuestionQuartiles and percentiles (discrete and continuous data)Assessment Practice
10 marks~15 minCriterion C
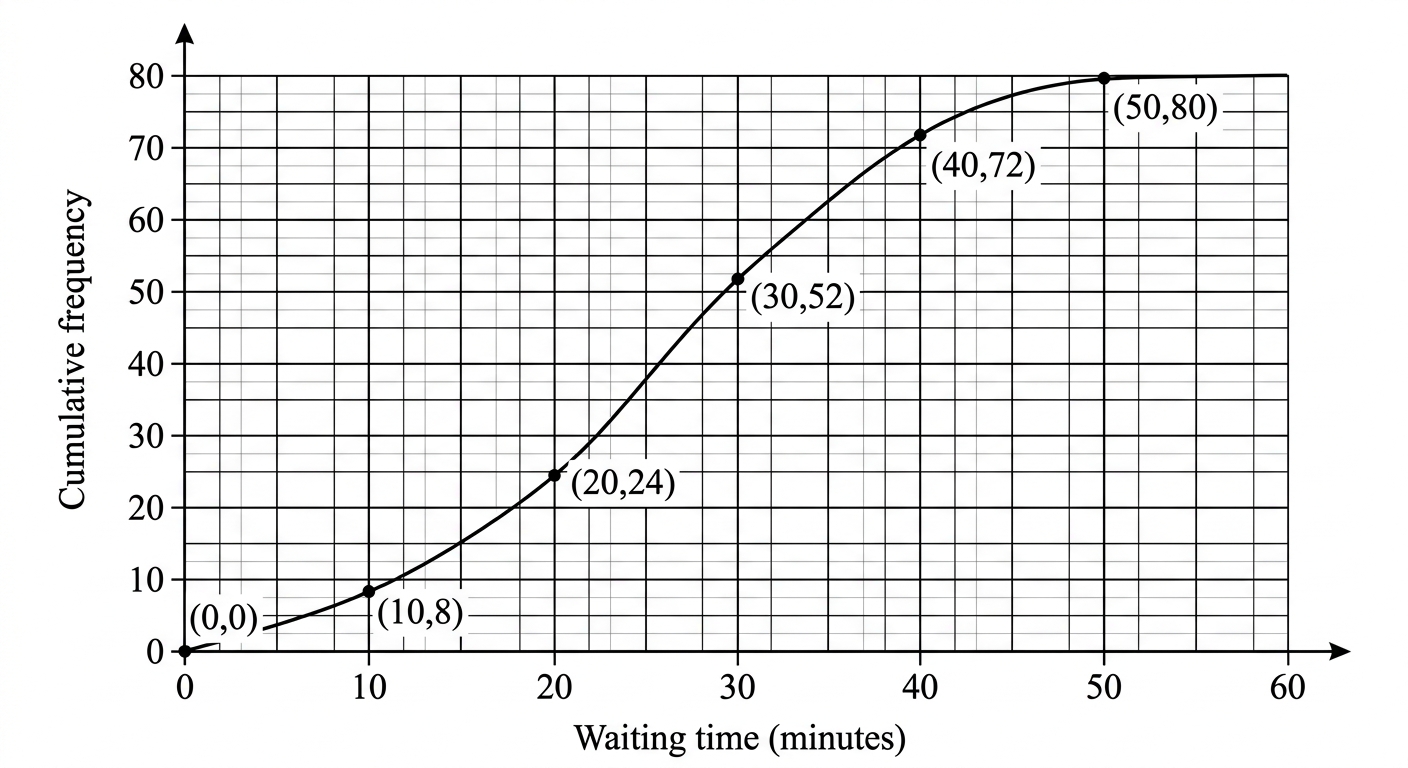
The cumulative frequency graph shows the waiting times, in minutes, for 80 patients at a health clinic. The graph passes through the points , , , , , and .
A student records the following attempt to find the quartiles:
: the 20th patient waited 12 minutes.
: the 40th patient waited 25 minutes.
: the 60th patient waited 33 minutes.
A student records the following attempt to find the quartiles:
: the 20th patient waited 12 minutes.
: the 40th patient waited 25 minutes.
: the 60th patient waited 33 minutes.
a
State two errors in the student's method. [2]
b
Using correct statistical notation, explain how to read the lower quartile from a cumulative frequency graph for data values. [3]
c
Using the graph, determine the correct values of , , and , and hence calculate the interquartile range. The clinic defines a "short wait" as any waiting time below the lower quartile. Justify whether a patient who waited 17 minutes experienced a short wait, giving your answer to the nearest minute. [5]
Solutions
4QuestionQuartiles and percentiles (discrete and continuous data)Assessment Practice
11 marks~17 minCriterion B
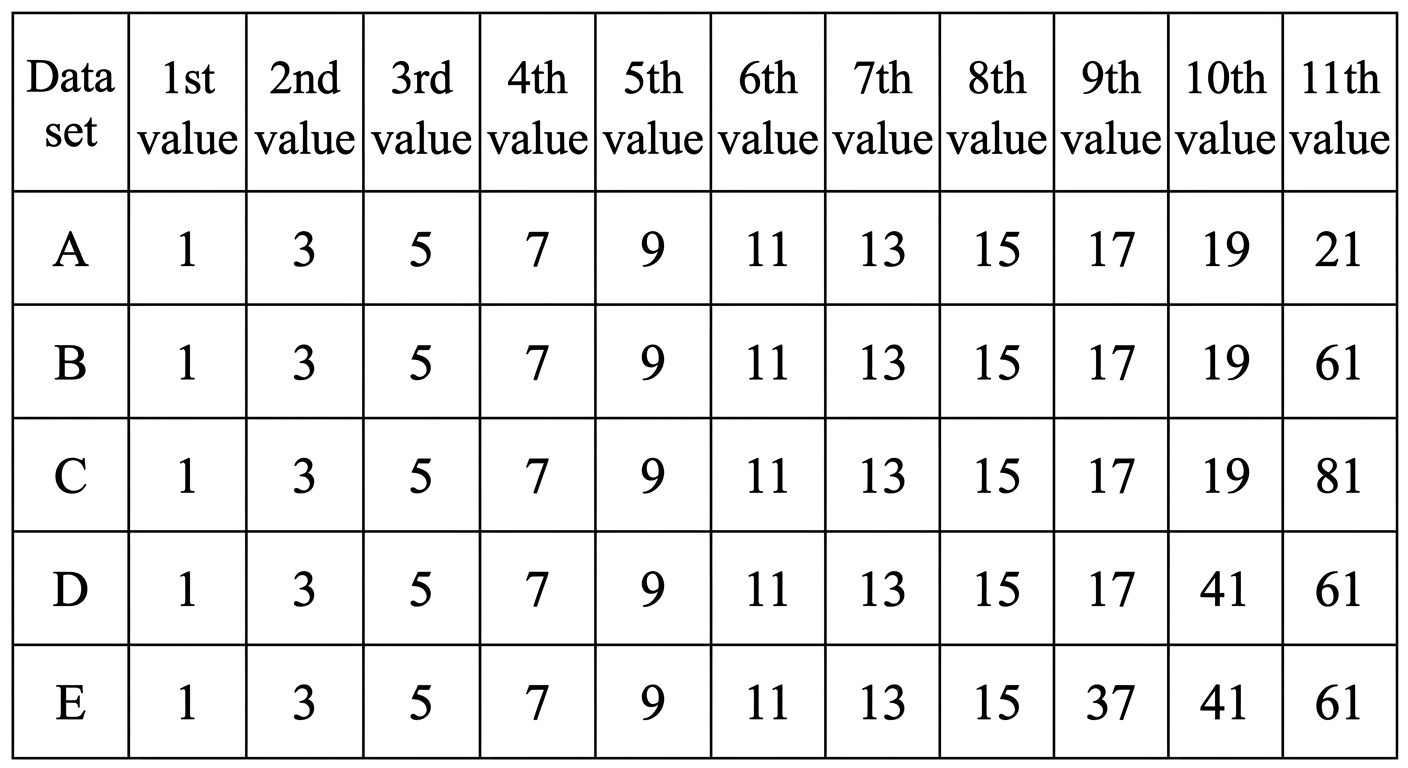
The table below shows five data sets, each containing 11 values listed in ascending order.
Data set A:
Data set B:
Data set C:
Data set D:
Data set E:
Data set A:
Data set B:
Data set C:
Data set D:
Data set E:
a
Find the median and interquartile range (IQR) for data set A. [3]
b
Complete the summary below by finding the median, , , and IQR for data sets B, C, D, and E. All values must be exact.
Describe the pattern you observe as the large value(s) move further into the data set from the maximum position. [4]
| Data set A — Median | : | : | IQR: | |
|---|---|---|---|---|
| Data set B — Median | \_\_\_ | : \_\_\_ | : \_\_\_ | IQR: \_\_\_ |
| Data set C — Median | \_\_\_ | : \_\_\_ | : \_\_\_ | IQR: \_\_\_ |
| Data set D — Median | \_\_\_ | : \_\_\_ | : \_\_\_ | IQR: \_\_\_ |
| Data set E — Median | \_\_\_ | : \_\_\_ | : \_\_\_ | IQR: \_\_\_ |
Describe the pattern you observe as the large value(s) move further into the data set from the maximum position. [4]
c
A classmate claims: "Making any value in the upper half of an ordered data set larger will always increase ." Justify whether this claim is correct or incorrect, referring to the definition of quartiles as positional measures and using at least two data sets from part (b) as evidence. [4]
Solutions
That's every free question here — 4 of 119.
+115 more questions, plus Mock Papers & Worksheets, are waiting in Premium.