You're viewing free preview questions — 4 questions previewing here — subscribe to unlock 311 more, plus the Full Question Bank, Mock Papers & Worksheets.Upgrade
Collecting and Organizing Data — Free MYP4 Mathematics (Extended) Practice Questions

1QuestionSimple discrete data and classificationAssessment Practice
5 marks~8 minCriterion A
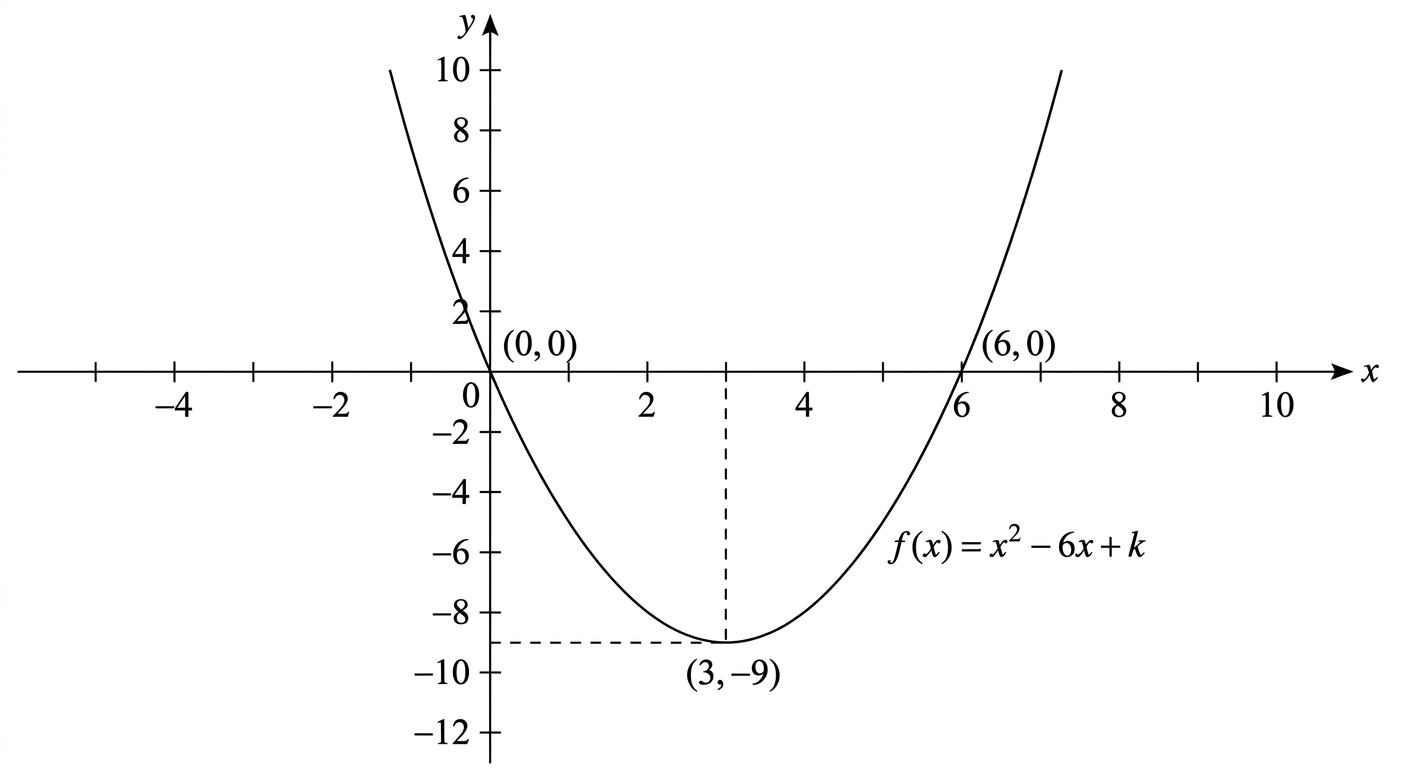
A quadratic function is given by , where is a constant.
a
Write down the axis of symmetry of . [1]
b
Find the value of such that has exactly one solution. [2]
c
Justify whether a value of produces two distinct real solutions to . [2]

Solutions
2QuestionOrganizing Data for Effective AnalysisAssessment Practice
6 marks~9 minCriterion C
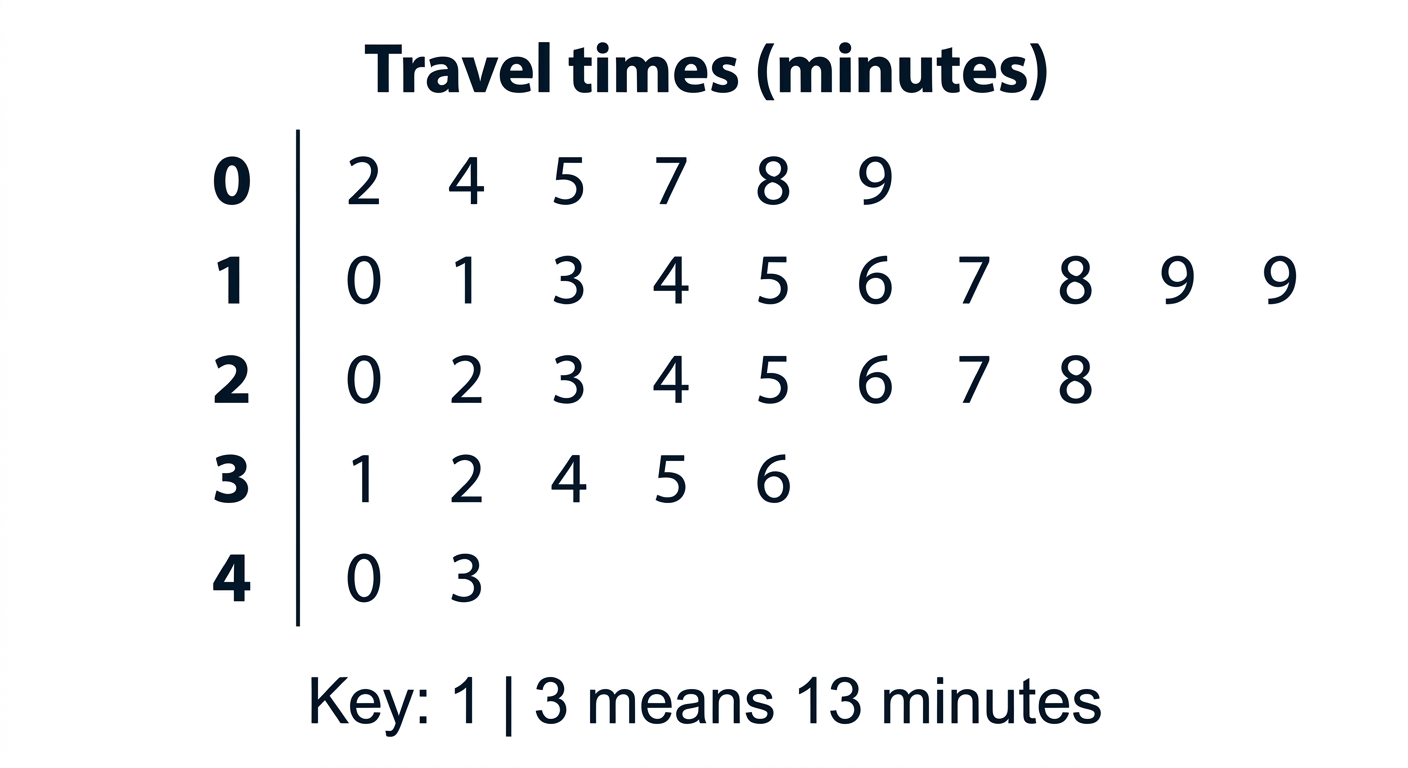
A school records the travel times (in minutes) of 50 students commuting to school. The stem-and-leaf plot below displays the full dataset.
Key: 1 | 9 represents 19 minutes
The same data are also organised into a grouped frequency table with intervals 0–10, 11–20, 21–30, 31–40, 41–50.
| Stem | Leaves |
|---|---|
| 0 | 2 5 7 8 9 |
| 1 | 1 3 4 6 7 9 9 |
| 2 | 0 2 3 5 6 8 |
| 3 | 1 2 4 5 7 8 |
| 4 | 0 1 3 |
Key: 1 | 9 represents 19 minutes
The same data are also organised into a grouped frequency table with intervals 0–10, 11–20, 21–30, 31–40, 41–50.
a
Using the stem-and-leaf plot, identify the modal travel time and calculate the range of travel times. [2]
b
Discuss one advantage and one disadvantage of using the grouped frequency table, compared with the stem-and-leaf plot, for determining the modal travel time and analysing the spread of the data. [2]
c
The school is deciding whether to introduce a subsidised bus service for students whose typical travel time falls within the most common 15-minute band. Analyse how changing the grouped frequency table intervals to 0–15, 16–30, 31–45, 46–60 affects the identified modal class, and advise the school whether the interval choice should influence its decision about which students qualify for the bus service. [2]
Solutions
3QuestionDesigning Surveys and QuestionnairesAssessment Practice
6 marks~9 minCriterion D
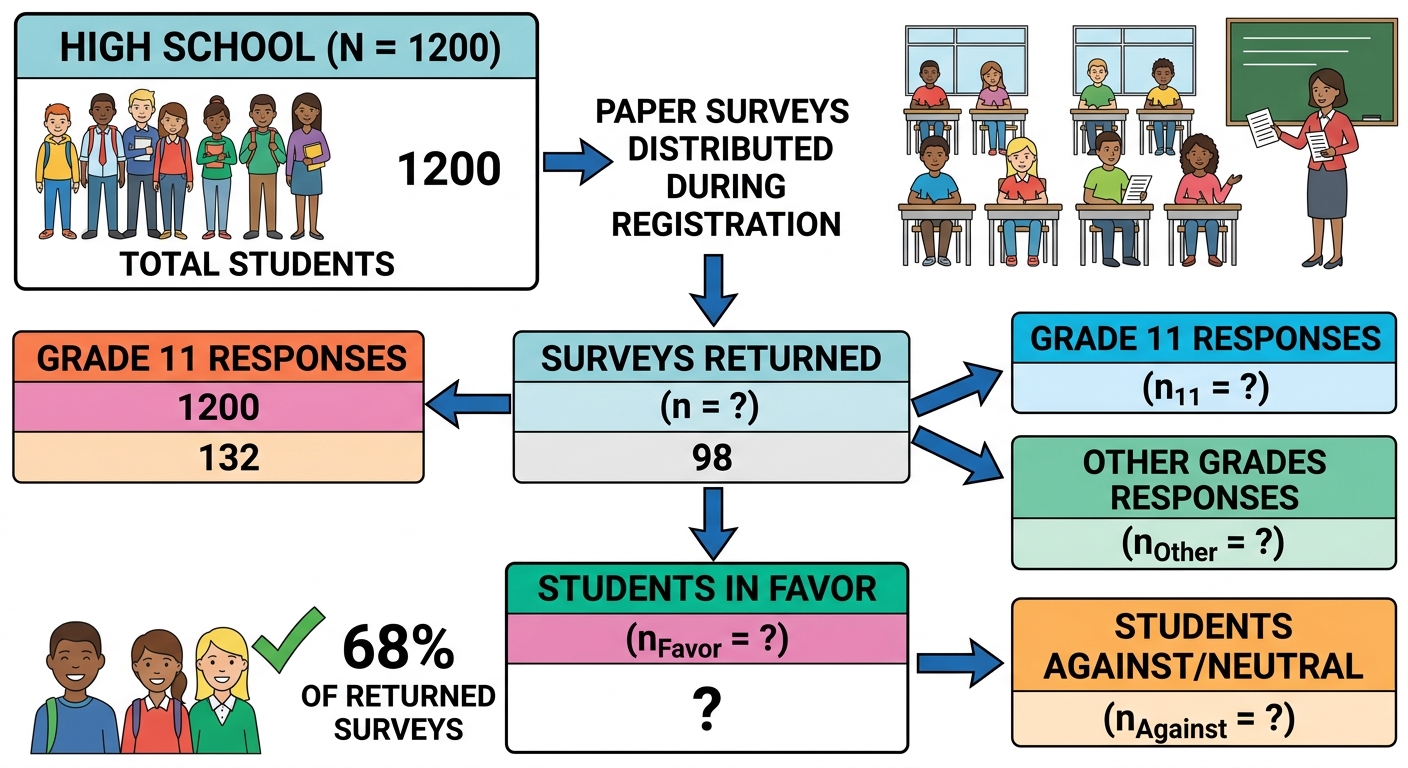
A school board surveys all 1200 students about a proposed new uniform policy. Paper surveys are distributed during morning registration; 144 are returned one week later. Of these, 132 responses are from Grade 11 students. Among all returned surveys, 98 students support the new policy. The board concludes the policy is popular and plans to implement it.
a
Calculate the response rate of this survey. [1]
b
Identify two distinct types of bias present in the survey results, supporting each with a calculation or specific evidence from the data. [3]
c
Advise the board whether the survey data are sufficient to justify implementing the new uniform policy. [2]
Solutions
4QuestionSimple discrete data and classificationAssessment Practice
10 marks~15 minCriterion B
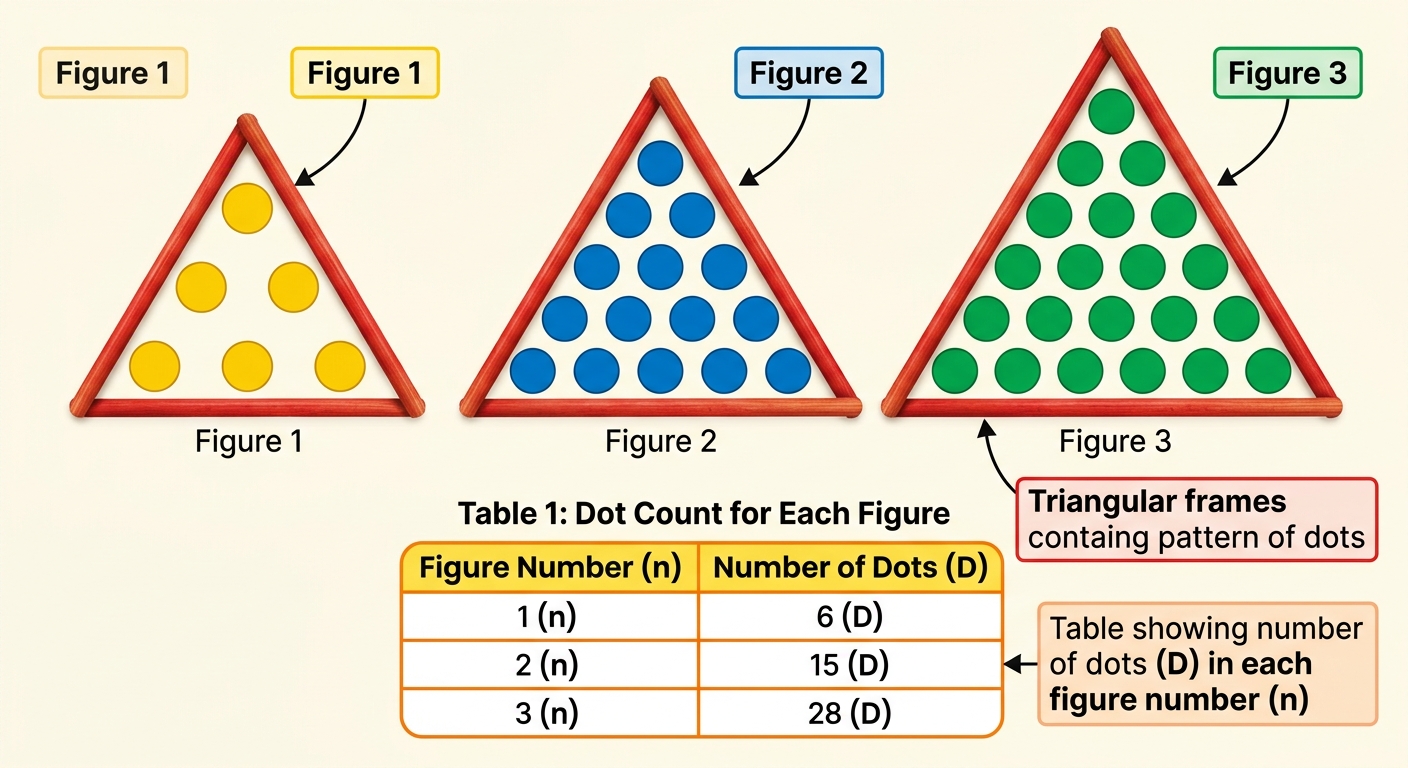
A pattern of dots is arranged in triangular frames. The first three figures are shown in the diagram.
The number of dots in Figure follows a quadratic rule of the form
The number of dots in Figure follows a quadratic rule of the form
| Figure number | 1 | 2 | 3 |
|---|---|---|---|
| Number of dots | 6 | 15 | 28 |
a
Find the values of , , and . [4]
b
Show that can be written in the factored form , and verify that this form gives the correct number of dots for . [3]
c
Justify why the rule must contain an term by referring to the structure of the dot pattern. [3]
Solutions
That's every free question here — 4 of 315.
+311 more questions, plus Mock Papers & Worksheets, are waiting in Premium.