You're viewing free preview questions — 4 questions previewing here — subscribe to unlock 85 more, plus the Full Question Bank, Mock Papers & Worksheets.Upgrade
Correlation — Free MYP4 Mathematics (Extended) Practice Questions

1QuestionLines of best fitAssessment Practice
6 marks~9 minCriterion C
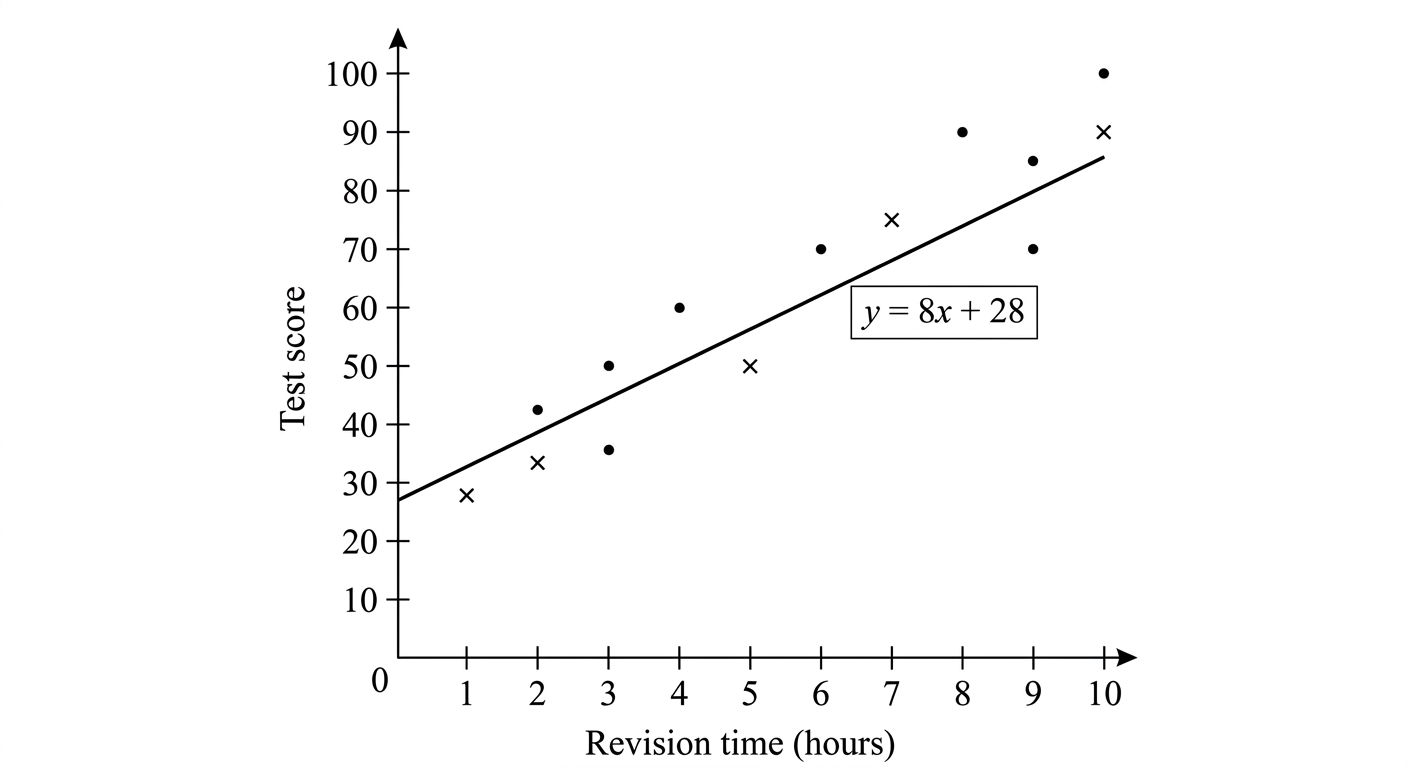
The scatter diagram below shows test scores (out of 100) and revision times (in hours) for 10 students. A line of best fit has been drawn with equation
where is revision time in hours and is the predicted test score.
The table below shows actual and predicted scores for three students.
where is revision time in hours and is the predicted test score.
The table below shows actual and predicted scores for three students.
| (hours) | 2 | 5 | 8 |
|---|---|---|---|
| Predicted | 44 | 68 | 92 |
| Actual | 50 | 65 | 80 |
a
Write down the -intercept of the line of best fit and interpret its meaning in this context. [2]
b
Calculate the percentage error for the student who revised for 8 hours, using
Give your answer correct to 1 decimal place. [2]
Give your answer correct to 1 decimal place. [2]
c
A student claims the model is equally reliable for predicting scores at 2 hours and at 8 hours of revision. Using the percentage errors for both and , assess whether this claim is correct. [2]

Solutions
2QuestionLines of best fitAssessment Practice
7 marks~11 minCriterion B
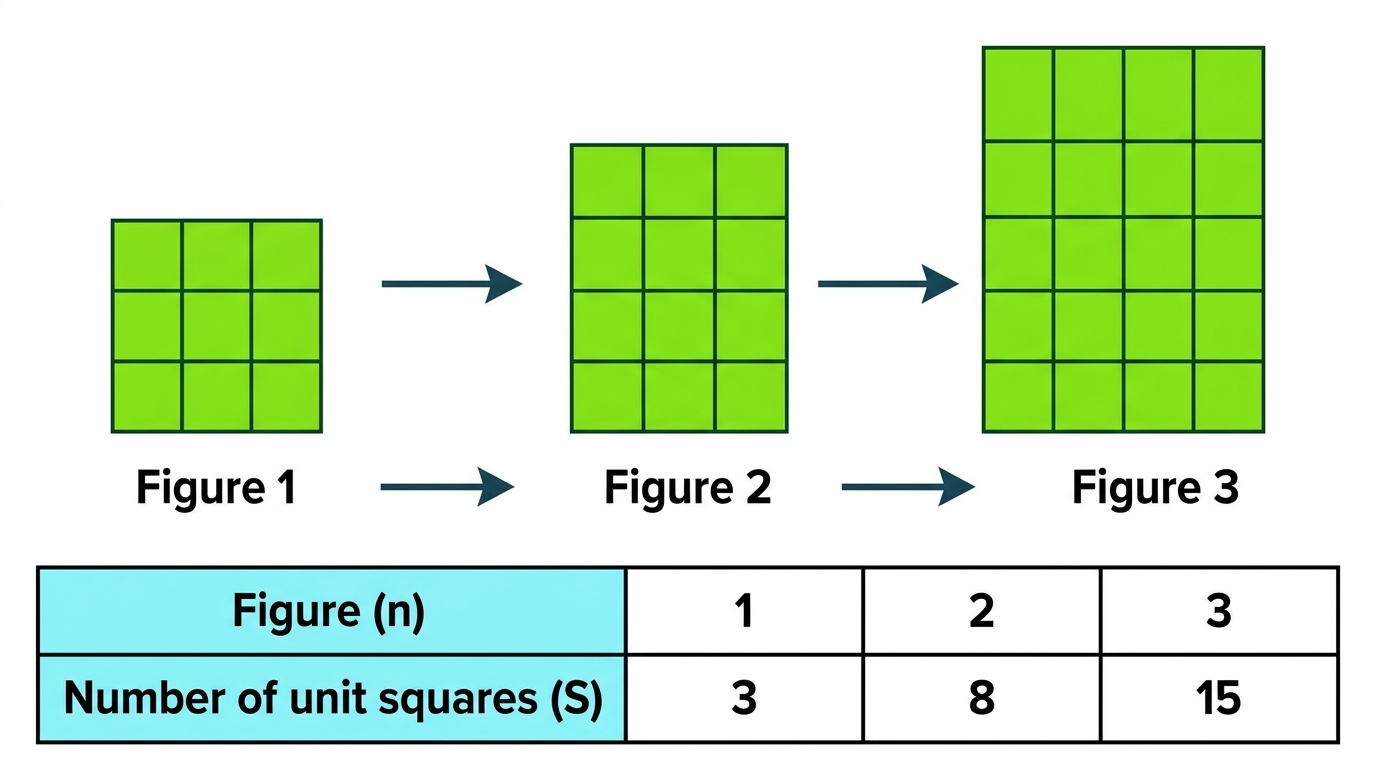
The diagram shows Figures 1, 2 and 3 of a pattern made from unit squares arranged in rectangles.
| Figure () | 1 | 2 | 3 |
|---|---|---|---|
| Squares () | 3 | 8 | 15 |
a
Write down the number of unit squares in Figure 4. [1]
b
Find a rule for the number of unit squares in Figure . Show that your rule can be written in the form
[3]
[3]
c
A student claims that is always an odd number when is odd. Justify this claim using your rule, then determine whether Figure 13 is the only figure for which , giving a reason for your answer. [3]
Solutions
3QuestionLines of best fitAssessment Practice
7 marks~11 minCriterion D
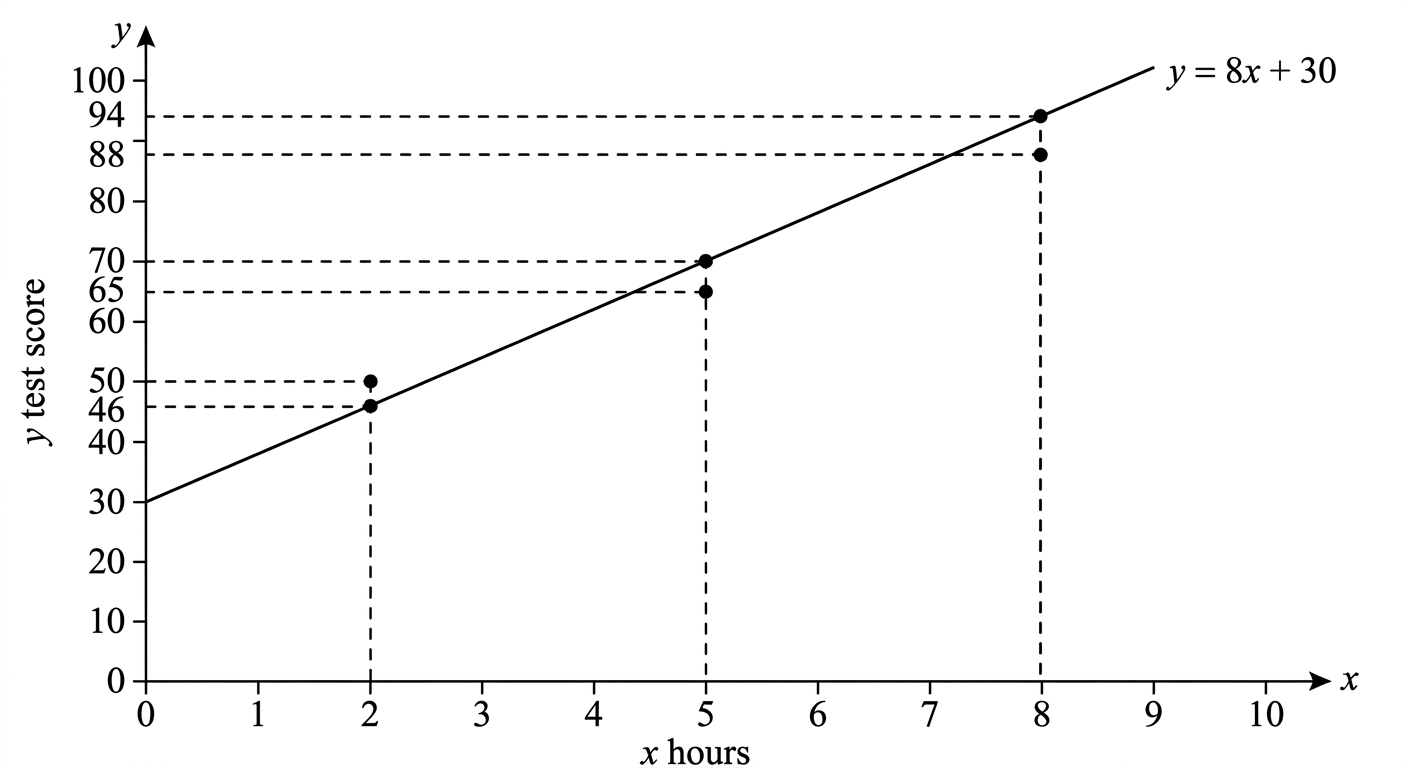
A survey records the number of hours studied per week () and the test score (, out of 100) for 10 students. A line of best fit is drawn with equation
The table below shows predicted and actual scores for three students.
The table below shows predicted and actual scores for three students.
| (hours) | 2 | 5 | 8 |
|---|---|---|---|
| Predicted | 46 | 70 | 94 |
| Actual | 50 | 65 | 88 |
a
Calculate the percentage error for the student who studied for 5 hours, using
Give your answer to 2 significant figures. [2]
Give your answer to 2 significant figures. [2]
b
A student claims she studied for 7 hours and scored 90. Deduce whether her score is above or below the score predicted by the model, and find the exact difference. [2]
c
Another student scored 74 on the test. Using the model, find the number of hours this student is predicted to have studied. Hence advise whether a teacher should use this model to predict the score of a student who studies for 12 hours, justifying your answer with reference to the data given. [3]
Solutions
4QuestionLines of best fitAssessment Practice
12 marks~18 minCriterion A
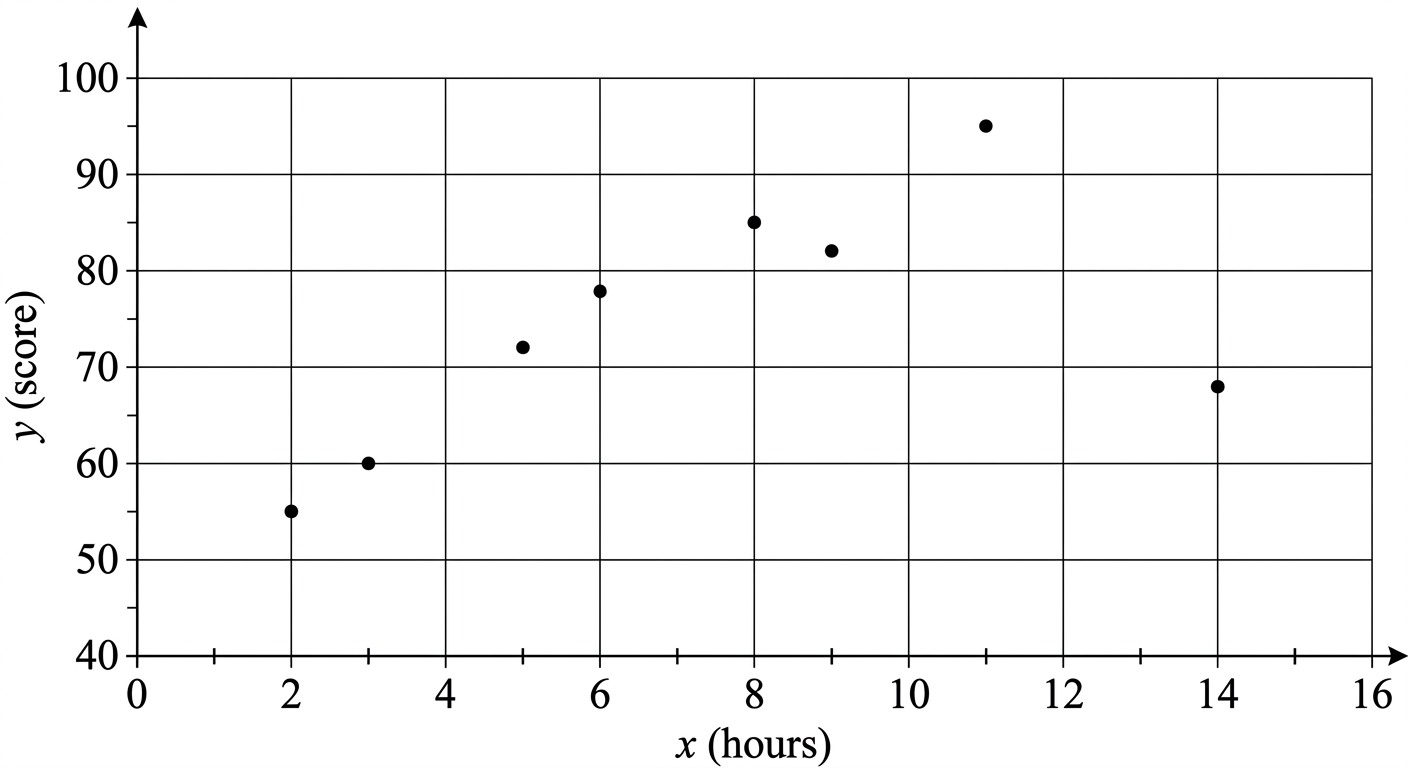
The table below shows the number of hours studied () and the test score () for 8 students.
(hours): 2, 3, 5, 6, 8, 9, 11, 14
(score): 55, 60, 72, 78, 85, 82, 95, 68
(hours): 2, 3, 5, 6, 8, 9, 11, 14
(score): 55, 60, 72, 78, 85, 82, 95, 68
a
State the coordinates of the point that appears to be an outlier, and give one reason why it is unusual. [2]
b
Using all 8 data points, calculate the equation of the line of best fit in the form , giving and each to 3 significant figures. Use the formulas
Hence predict the test score for a student who studies for 10 hours, giving your answer to the nearest integer. [5]
Hence predict the test score for a student who studies for 10 hours, giving your answer to the nearest integer. [5]
c
The outlier is removed. A student claims that removing this single point will increase the gradient of the line of best fit by more than 100%. Recalculate and for the remaining 7 data points (each to 3 significant figures) and justify whether the student's claim is correct. [5]
Solutions
That's every free question here — 4 of 89.
+85 more questions, plus Mock Papers & Worksheets, are waiting in Premium.