You're viewing free preview questions — 4 questions previewing here — subscribe to unlock 114 more, plus the Full Question Bank, Mock Papers & Worksheets.Upgrade
Graphs and Data Representation — Free MYP4 Mathematics (Extended) Practice Questions

1QuestionStem-and-leaf plots and pictogramsAssessment Practice
8 marks~12 minCriterion A
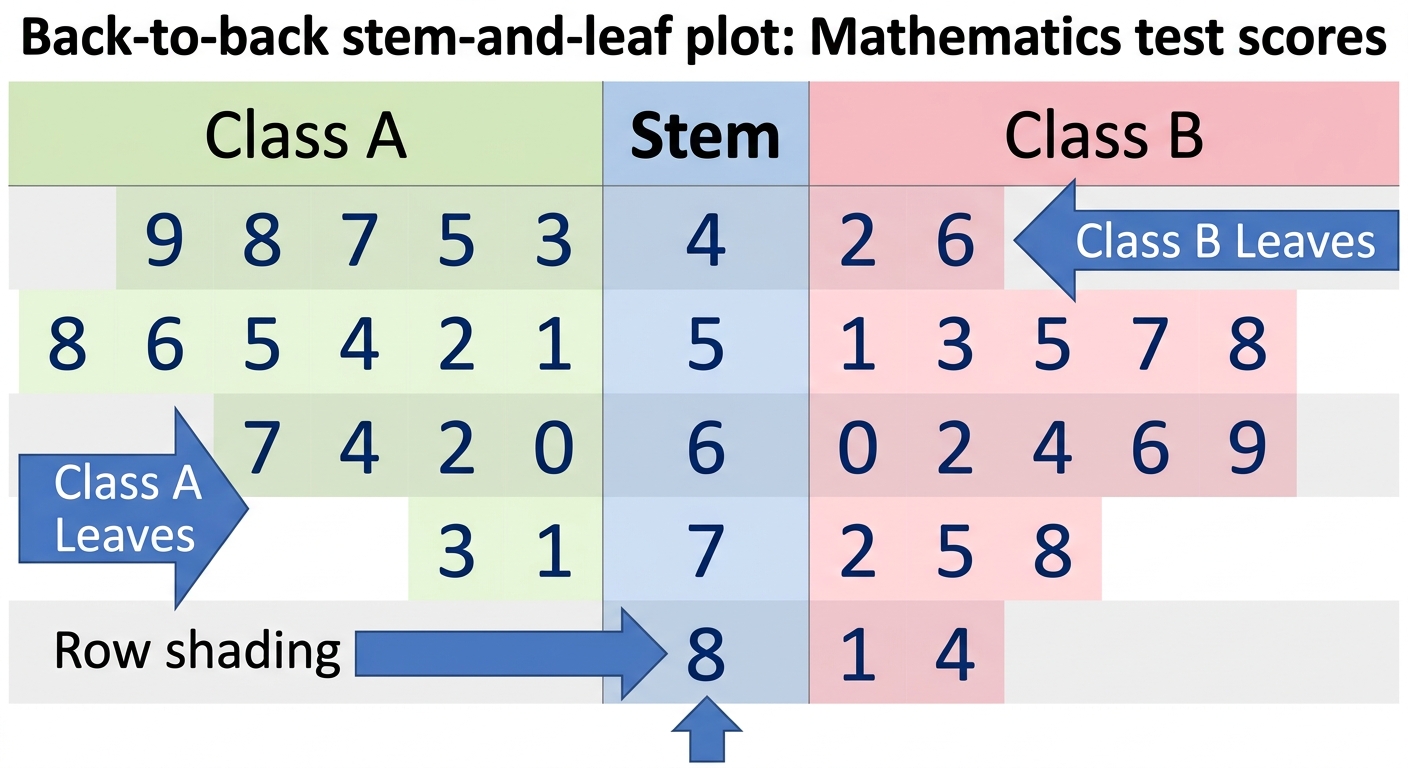
The back-to-back stem-and-leaf plot below shows the scores (out of 100) for two classes on the same mathematics test.
Class A (leaves) Stem Class B (leaves)
Leaves are read outward from the stem. For example, Class A's row for stem 4 represents the scores 43, 45, 47, 48, 49.
Class A (leaves) Stem Class B (leaves)
Leaves are read outward from the stem. For example, Class A's row for stem 4 represents the scores 43, 45, 47, 48, 49.
a
Write down the median and the interquartile range (IQR) for Class A. [2]
b
Find the mean and standard deviation for Class B. Give your answers correct to 3 significant figures. [3]
c
A teacher must decide which class to enter into an inter-school mathematics competition. The competition selects students who score above 65. Using your answers from parts (a) and (b), and the distributions visible in the stem-and-leaf plot, evaluate which class is better suited for the competition, and justify your recommendation. [3]

Solutions
2QuestionStem-and-leaf plots and pictogramsAssessment Practice
8 marks~12 minCriterion D
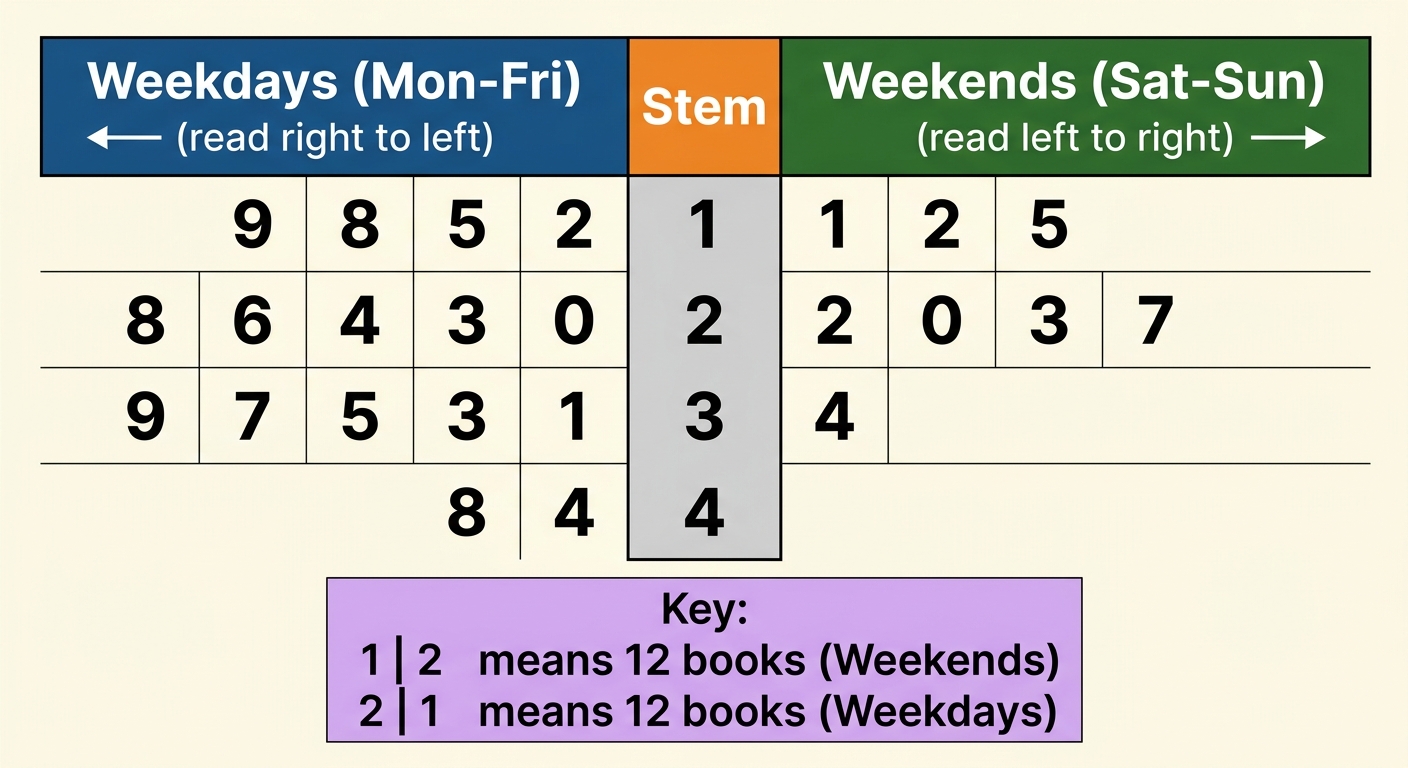
A school library records the number of books borrowed each day over two weeks. The back-to-back stem-and-leaf plot below shows daily borrowing figures for weekdays (Monday–Friday) on the left and weekend days (Saturday–Sunday) on the right. The library was closed on one Monday due to a public holiday; that day is not included, giving 9 weekday values and 4 weekend values.
Key: 9 | 1 means 19 books (weekdays); 1 | 2 means 12 books (weekends)
The sorted weekday values (9 values) are: 18, 19, 23, 24, 26, 35, 37, 38, 48.
| Weekdays (read right to left) | Stem | Weekends (read left to right) |
|---|---|---|
| 9 8 | 1 | 2 5 |
| 6 4 3 | 2 | 0 7 |
| 7 5 3 | 3 | 1 |
| 8 | 4 | 2 |
Key: 9 | 1 means 19 books (weekdays); 1 | 2 means 12 books (weekends)
The sorted weekday values (9 values) are: 18, 19, 23, 24, 26, 35, 37, 38, 48.
a
State the median number of books borrowed per weekday. [1]
b
The library manager uses the mean of the weekend data as a model for a "typical weekend day." Calculate the mean number of books borrowed per weekend day, giving your answer to the nearest whole number. [2]
c
The missing Monday is now included. Library records show that Mondays consistently have among the highest daily borrowing figures for weekdays. A student claims: "Including the missing Monday will increase the weekday median."
Justify whether the student's claim is correct, showing clearly how the median changes when a value greater than 38 is added. [3]
Justify whether the student's claim is correct, showing clearly how the median changes when a value greater than 38 is added. [3]
d
The library manager intends to present this two-week dataset to the school board as evidence of typical daily borrowing throughout the entire school year, in order to justify a budget increase. Evaluate whether the dataset provides sufficient evidence for this purpose. [2]
Solutions
3QuestionData visualizations and infographicsAssessment Practice
8 marks~12 minCriterion C
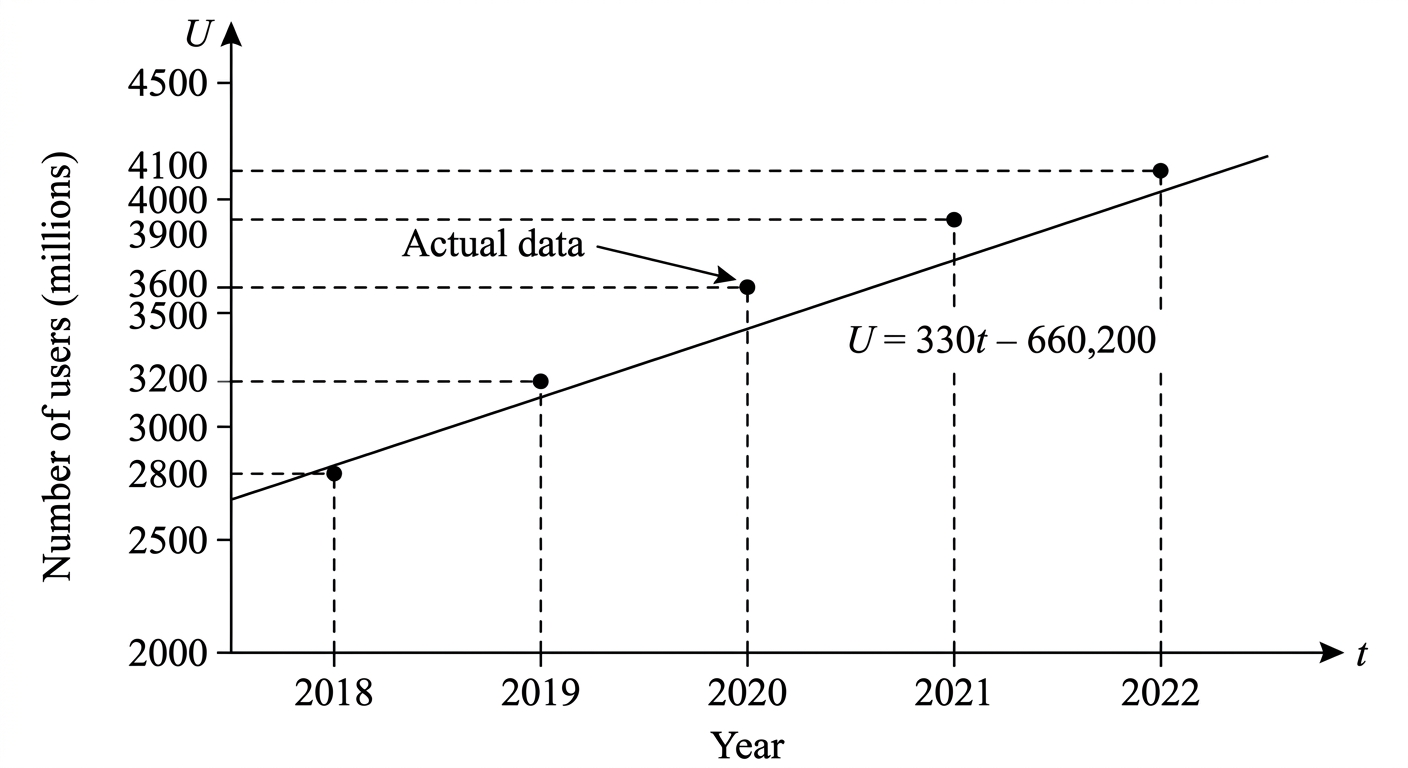
The table below shows the global number of smartphone users (in millions) for the years 2018 to 2022, together with the values predicted by the linear model where is the year.
| Year | 2018 | 2019 | 2020 | 2021 | 2022 |
|---|---|---|---|---|---|
| Actual (millions) | 2800 | 3200 | 3600 | 3900 | 4100 |
| Predicted (millions) | 2740 | 3070 | 3400 | 3730 | 4060 |
a
Calculate the percentage error for the year 2022, using the formula Give your answer correct to 2 significant figures. [2]
b
A student claims the linear model is a good fit because the predicted values are always within 5% of the actual values. Determine whether this claim holds for every year in the table, showing your working for each year. [3]
c
The diagram shows the actual data points and the linear model plotted on the same axes. Assess whether the linear model or a quadratic model would be more appropriate for predicting smartphone users beyond 2022, referring to the trend visible in the residuals and to one limitation of extrapolation. [3]
Solutions
4QuestionStem-and-leaf plots and pictogramsAssessment Practice
10 marks~15 minCriterion B
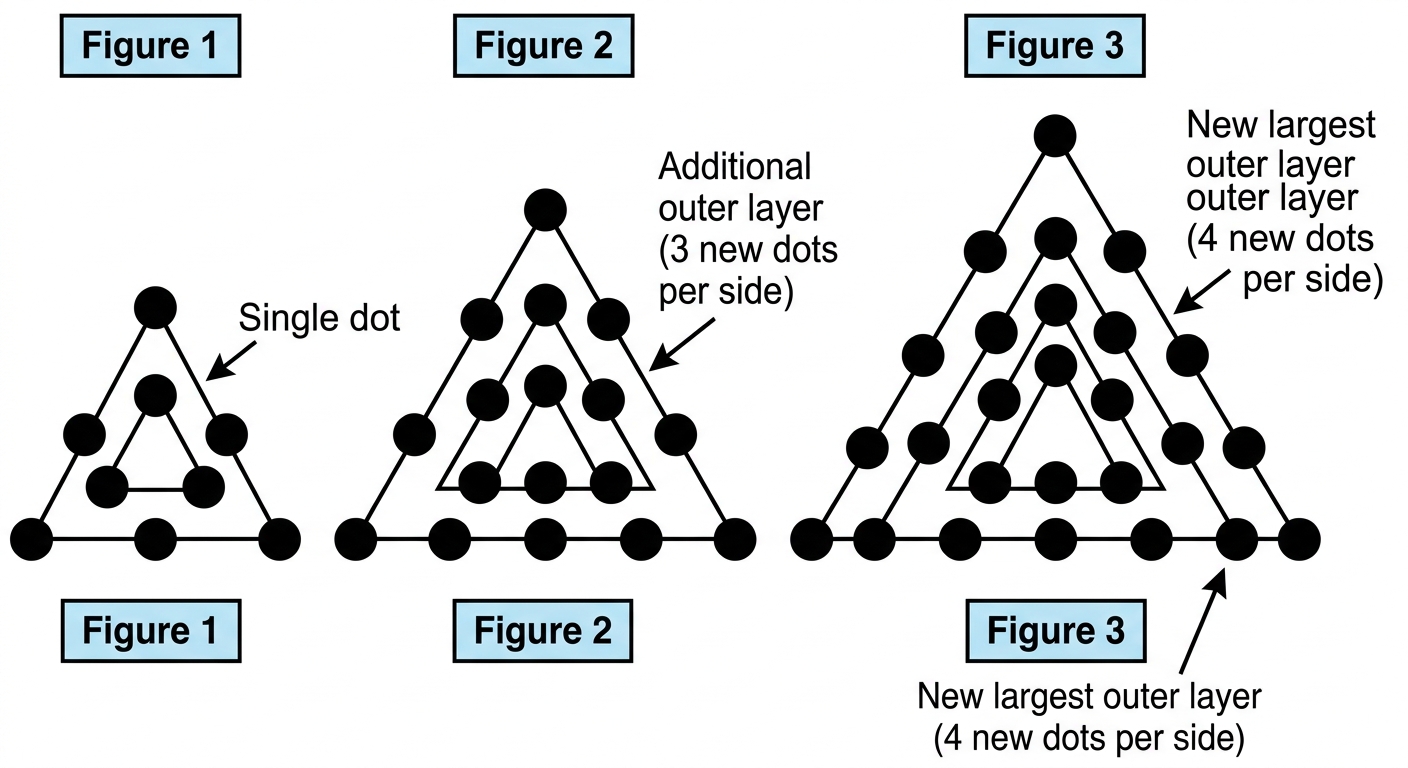
The diagram shows a growing pattern of dots arranged in triangular frames. Figure 1 has 8 dots, Figure 2 has 15 dots, and Figure 3 has 24 dots.
a
Find the number of dots in Figure 4 and Figure 5. [2]
b
A student claims the number of dots in Figure can be written in the form
where , , and are integers. Use any three figures to form a system of equations and solve to find the values of , , and . [4]
where , , and are integers. Use any three figures to form a system of equations and solve to find the values of , , and . [4]
c
The student says: "Since the second differences of the sequence are constant, the rule must be quadratic, and the coefficient tells us how the pattern grows layer by layer." Verify that the second differences are constant and equal to 2, then justify whether the student's claim that the rule must be quadratic is correct. [4]
Solutions
That's every free question here — 4 of 118.
+114 more questions, plus Mock Papers & Worksheets, are waiting in Premium.