You're viewing free preview questions — 4 questions previewing here — subscribe to unlock 99 more, plus the Full Question Bank, Mock Papers & Worksheets.Upgrade
Measures of Dispersion — Free MYP4 Mathematics (Extended) Practice Questions

1QuestionRange and Interquartile RangeConcept Practice
4 marks~6 minCriterion A
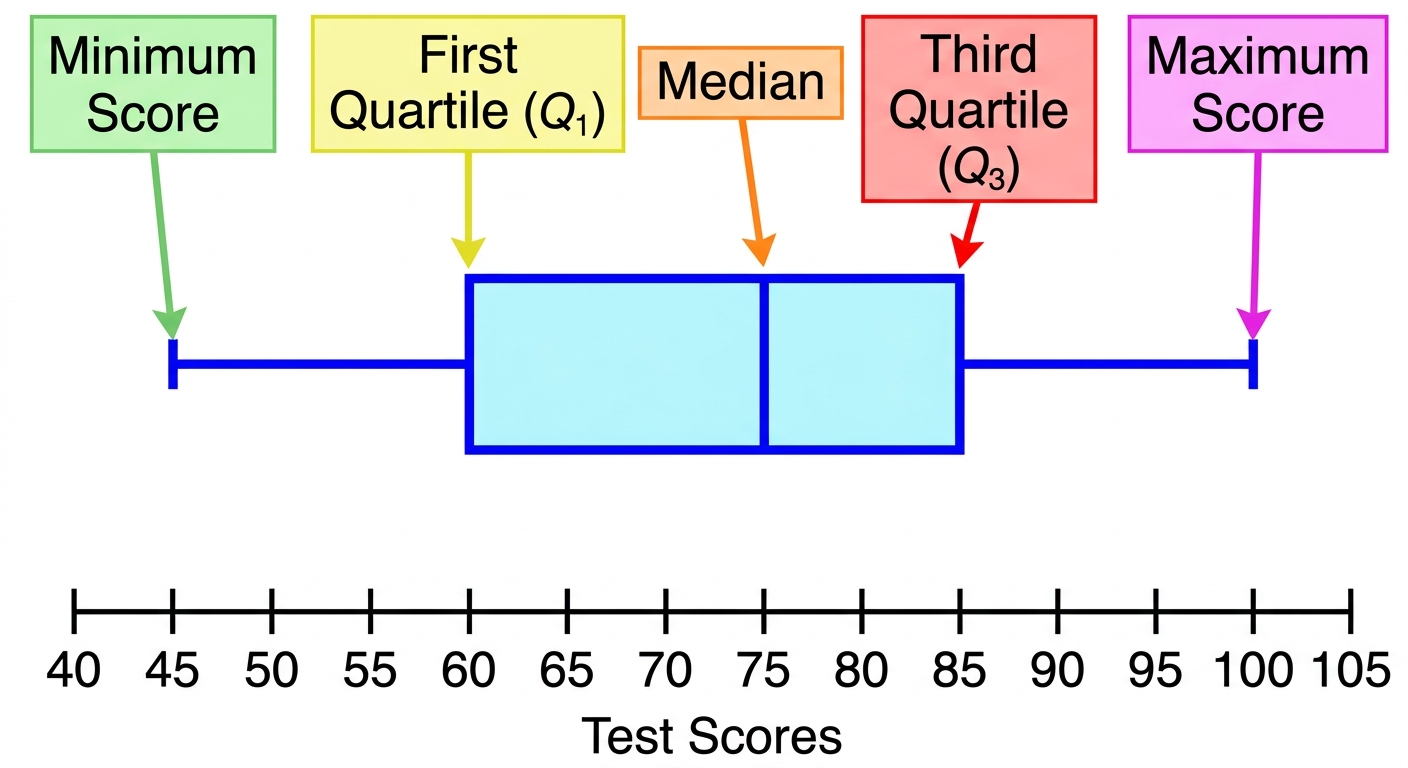
A school uses the following box-and-whisker plot to report class test scores.
The school's performance policy states that a class is considered consistent if its IQR is less than half its range.
The school's performance policy states that a class is considered consistent if its IQR is less than half its range.
a
Calculate the range and the interquartile range (IQR) of the test scores. [2]
b
Explain how the IQR and the range each describe the spread of the test scores differently. [1]
c
Justify whether this class meets the school's consistency condition, using your results from part (a). [1]

Solutions
2QuestionComparing Variability Between Data SetsAssessment Practice
6 marks~9 minCriterion C
A store manager models daily sales as dollars, predicting that sales will range across a spread of dollars.
The actual daily sales (in dollars) over 10 days are recorded below.
Day: 1, 2, 3, 4, 5, 6, 7, 8, 9, 10
Sales: 122, 135, 112, 128, 118, 108, 130, 125, 132, 115
The actual daily sales (in dollars) over 10 days are recorded below.
Day: 1, 2, 3, 4, 5, 6, 7, 8, 9, 10
Sales: 122, 135, 112, 128, 118, 108, 130, 125, 132, 115
a
Calculate the range of the actual sales data. [2]
b
Calculate the interquartile range (IQR) of the actual sales data. [2]
c
Critique the manager's claim that the model is reliable because the predicted spread of dollars is close to the actual range. Use both the range and IQR in your response. [2]
Solutions
3QuestionBox and Whisker Plots for Spread of DataAssessment Practice
6 marks~9 minCriterion D
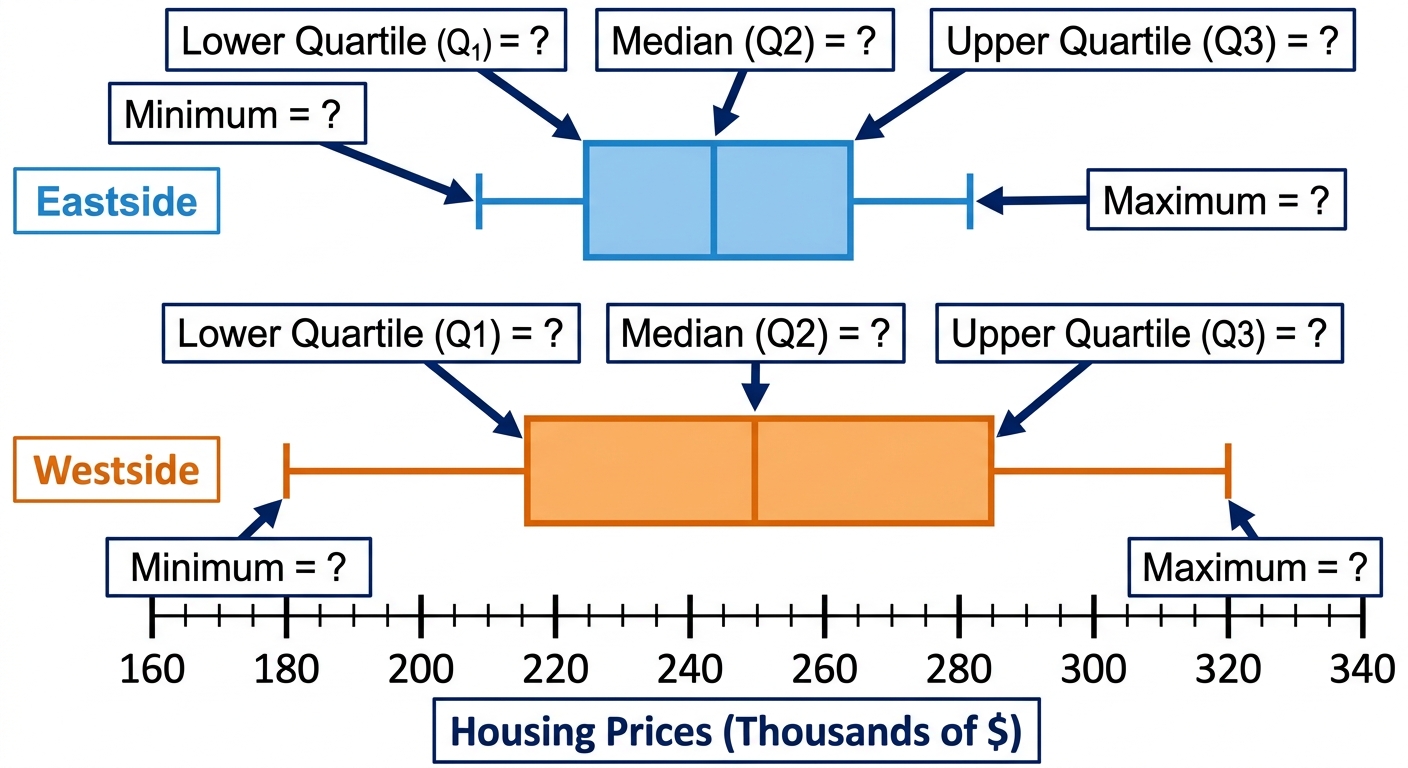
A city planner is comparing housing prices in two neighbourhoods, Eastside and Westside, to decide where to invest in affordable housing programmes.
Prices (thousands of dollars):
Eastside: 210, 215, 220, 225, 230, 235, 240, 245, 250, 255, 260, 265, 270, 275, 280
Westside: 180, 190, 200, 210, 220, 230, 240, 250, 260, 270, 280, 290, 300, 310, 320
Prices (thousands of dollars):
Eastside: 210, 215, 220, 225, 230, 235, 240, 245, 250, 255, 260, 265, 270, 275, 280
Westside: 180, 190, 200, 210, 220, 230, 240, 250, 260, 270, 280, 290, 300, 310, 320
a
Calculate the five-number summary (minimum, , median, , maximum) for each neighbourhood. [2]
b
Calculate the interquartile range (IQR) and range for each neighbourhood. [2]
c
Construct box-and-whisker plots for both neighbourhoods on the same scale. [1]
d
The city planner states: "Eastside is the better target for affordable housing investment because its prices are more consistent." Advise the city planner whether the measures of spread support this conclusion, and identify one limitation of relying solely on IQR and range for this decision. [1]
Solutions
4QuestionRange and standard deviationAssessment Practice
6 marks~9 minCriterion B
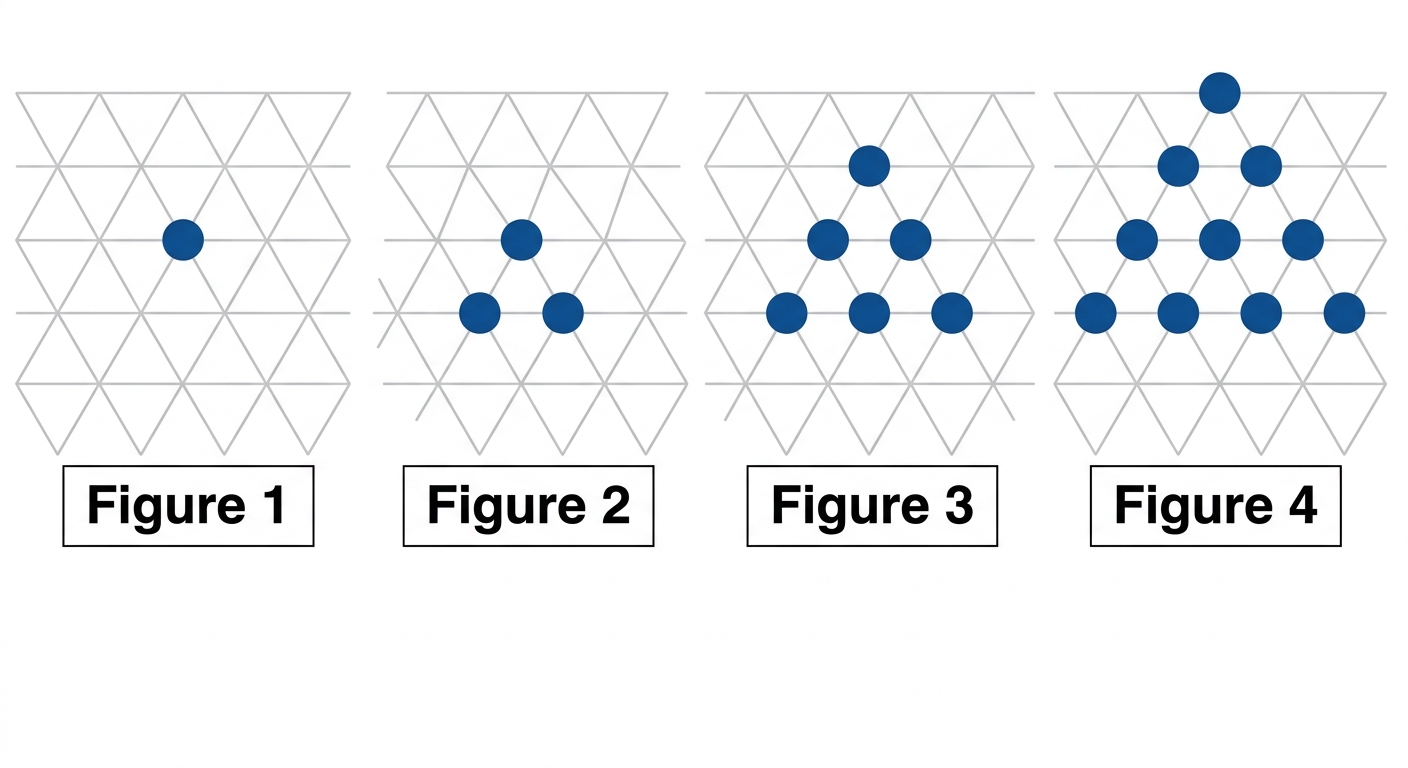
The diagram shows Figures 1 to 4 of a pattern made from dots arranged in a triangular grid.
Figure 1 has 1 dot, Figure 2 has 3 dots, Figure 3 has 6 dots, and Figure 4 has 10 dots.
Figure 1 has 1 dot, Figure 2 has 3 dots, Figure 3 has 6 dots, and Figure 4 has 10 dots.
a
Write down the number of dots added when going from Figure 3 to Figure 4. [1]
b
Find a rule for the number of dots in Figure , giving your answer in the form
Verify your rule for Figure 3. [3]
Verify your rule for Figure 3. [3]
c
A student claims that Figure 16 is the first figure in the pattern to contain more than 100 dots. Justify whether the student is correct. [2]
Solutions
That's every free question here — 4 of 103.
+99 more questions, plus Mock Papers & Worksheets, are waiting in Premium.