You're viewing free preview questions — 4 questions previewing here — subscribe to unlock 45 more, plus the Full Question Bank, Mock Papers & Worksheets.Upgrade
Exponential Functions — Free MYP4 Mathematics (Standard) Practice Questions

1QuestionGraphing exponentialConcept Practice
2 marks~3 minCriterion A
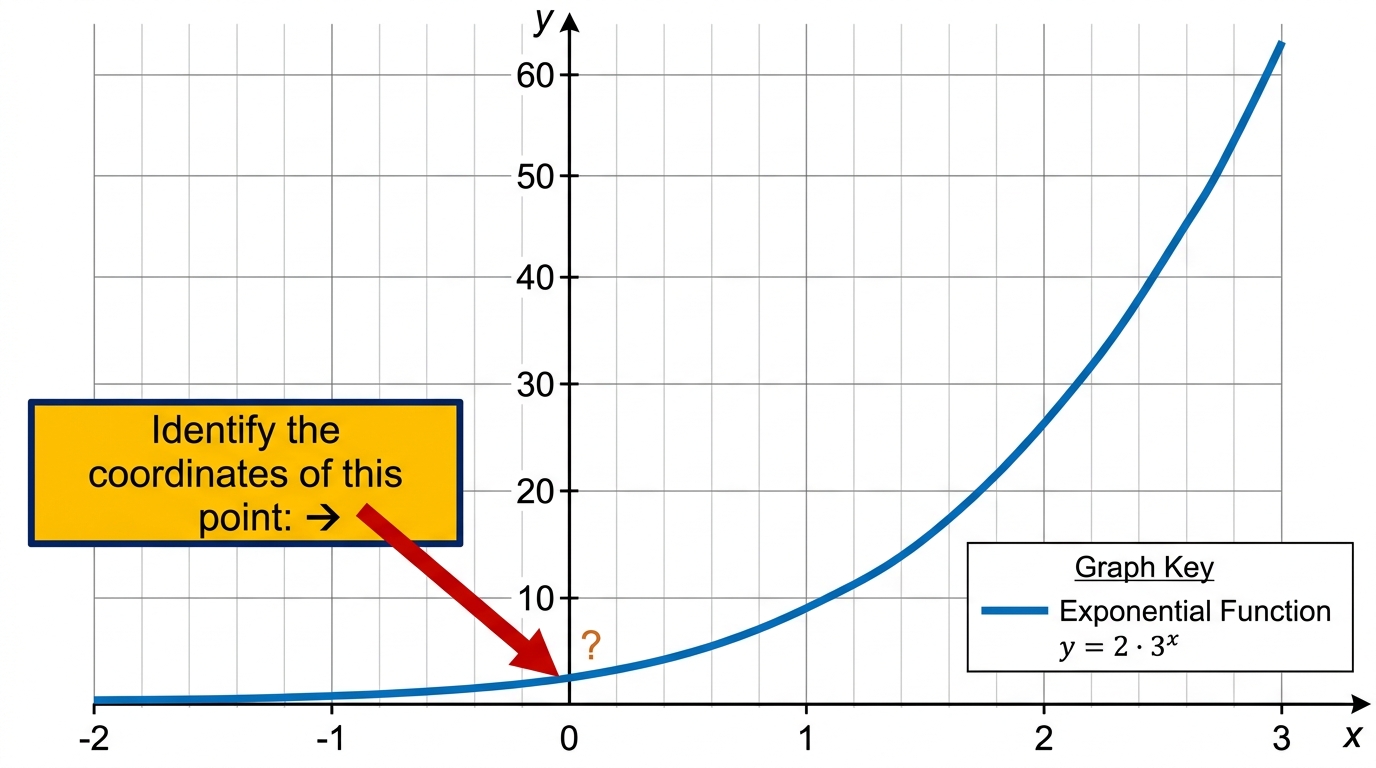
A laboratory culture of bacteria begins with 2 000 cells. The population is modelled by , where is the time in hours after the experiment starts and is the number of bacteria.
A biologist states: "At the start of the experiment, the population is already above 1 500 cells."
A biologist states: "At the start of the experiment, the population is already above 1 500 cells."
a
Determine the value of when . [1]
b
Justify whether the biologist's claim is correct. [1]

Solutions
2QuestionGraphing exponentialAssessment Practice
2 marks~3 minCriterion B
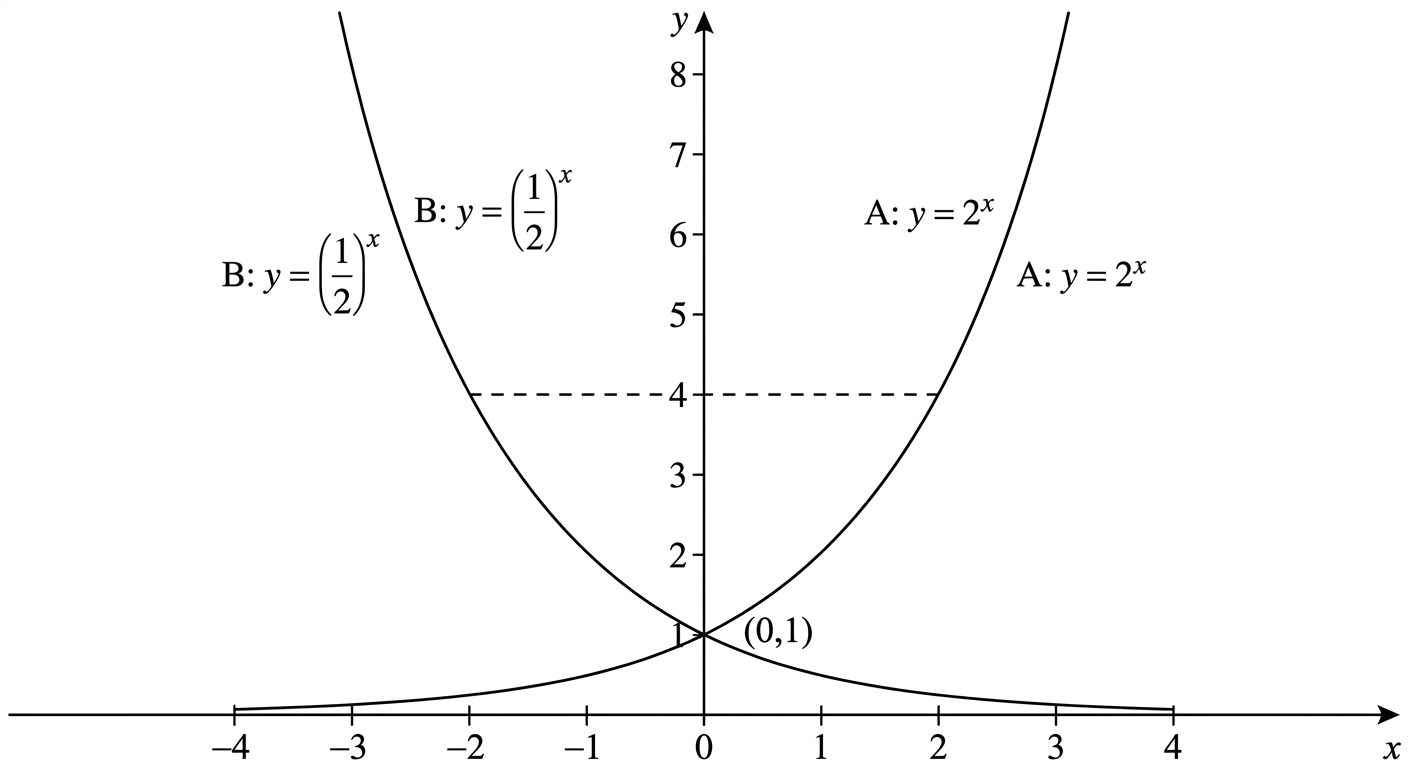
The graph shows two exponential functions: curve A, , and curve B, .
Explain why the two curves are reflections of each other across the -axis, using the relationship between the two functions. In your answer, state what this means for a general point on curve A. [2]
Explain why the two curves are reflections of each other across the -axis, using the relationship between the two functions. In your answer, state what this means for a general point on curve A. [2]
Solutions
3QuestionGraphing exponentialAssessment Practice
5 marks~8 minCriterion C
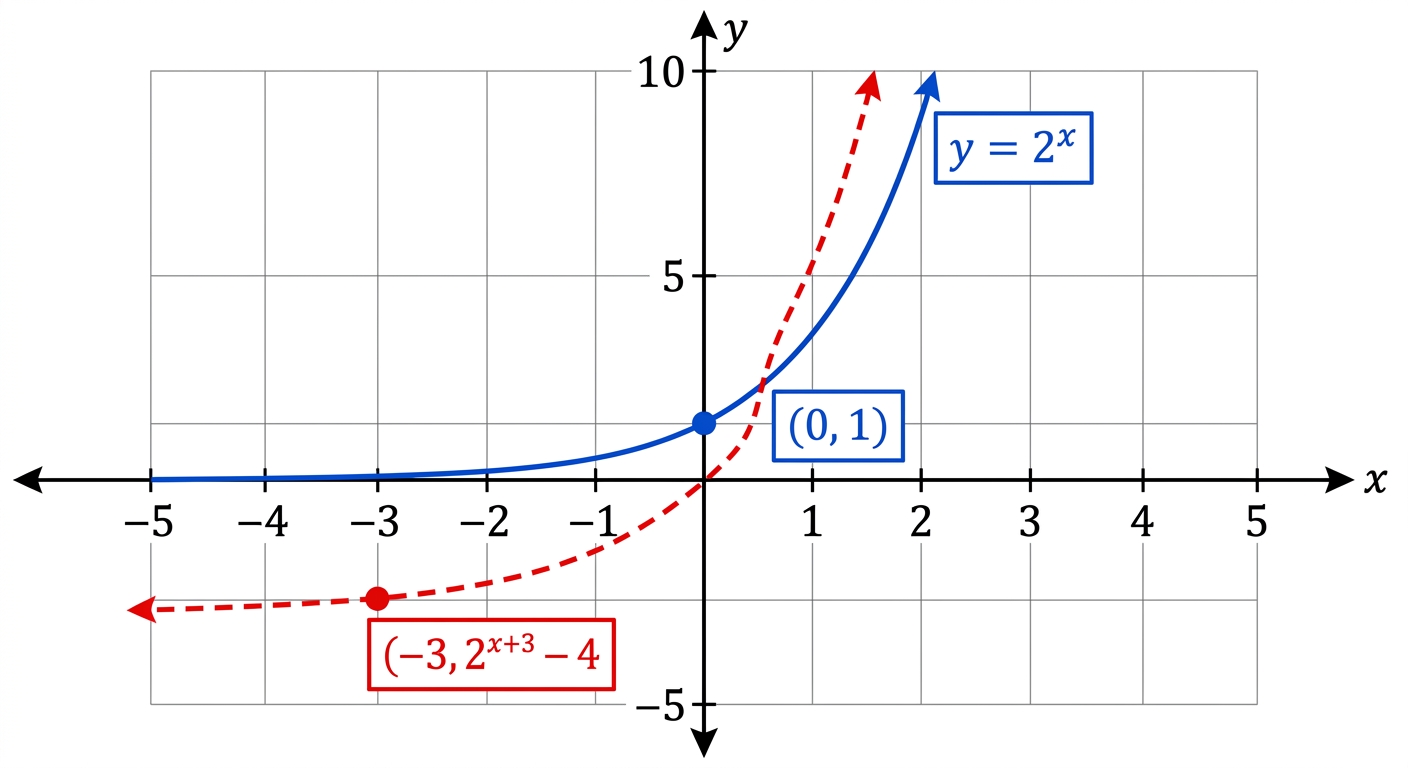
A bacteria culture grows according to , where is time in hours and is population in thousands. A researcher models a modified strain using .
a
State the two transformations that map onto . [1]
b
A student claims that the point on maps to on . Justify why this claim is incorrect, and determine the correct image of . [2]
c
The modified strain is only viable when its population exceeds zero. Deduce the value of at which the population first becomes positive, and assess whether this model is biologically valid from onwards. [2]
Solutions
4QuestionGraphing exponentialAssessment Practice
8 marks~12 minCriterion D
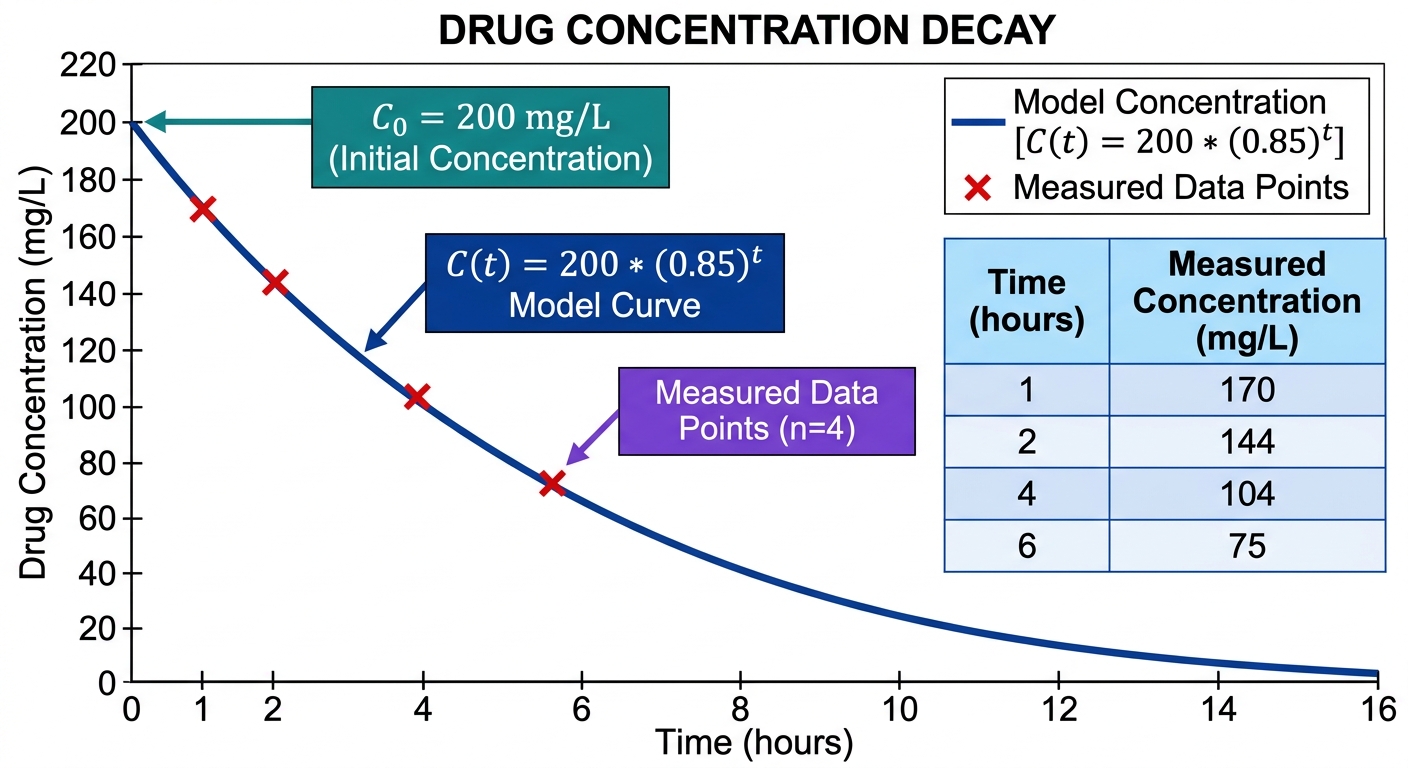
A pharmaceutical company models the concentration of a drug in a patient's bloodstream as
mg/L, where is the time in hours after injection. A nurse records the following measured concentrations:
mg/L, where is the time in hours after injection. A nurse records the following measured concentrations:
| Time (hours) | 1 | 2 | 4 | 6 |
|---|---|---|---|---|
| Measured concentration (mg/L) | 170 | 144 | 104 | 75 |
a
Calculate the predicted concentration at each time point using the model. Present your results alongside the measured values. [2]
b
Calculate the percentage error at each time point using
Round to one decimal place. [2]
Round to one decimal place. [2]
c
Advise the nurse whether this model alone is sufficient for making clinical dosing decisions. In your response, discuss at least two limitations of the model and justify your advice by interpreting your percentage error results in a medical context. [4]
Solutions
That's every free question here — 4 of 49.
+45 more questions, plus Mock Papers & Worksheets, are waiting in Premium.