You're viewing free preview questions — 3 questions previewing here — subscribe to unlock 35 more, plus the Full Question Bank, Mock Papers & Worksheets.Upgrade
Interpreting Real-Life Graphs — Free MYP4 Mathematics (Standard) Practice Questions

1QuestionEstimating Values and Trends from GraphsAssessment Practice
4 marks~6 minCriterion A
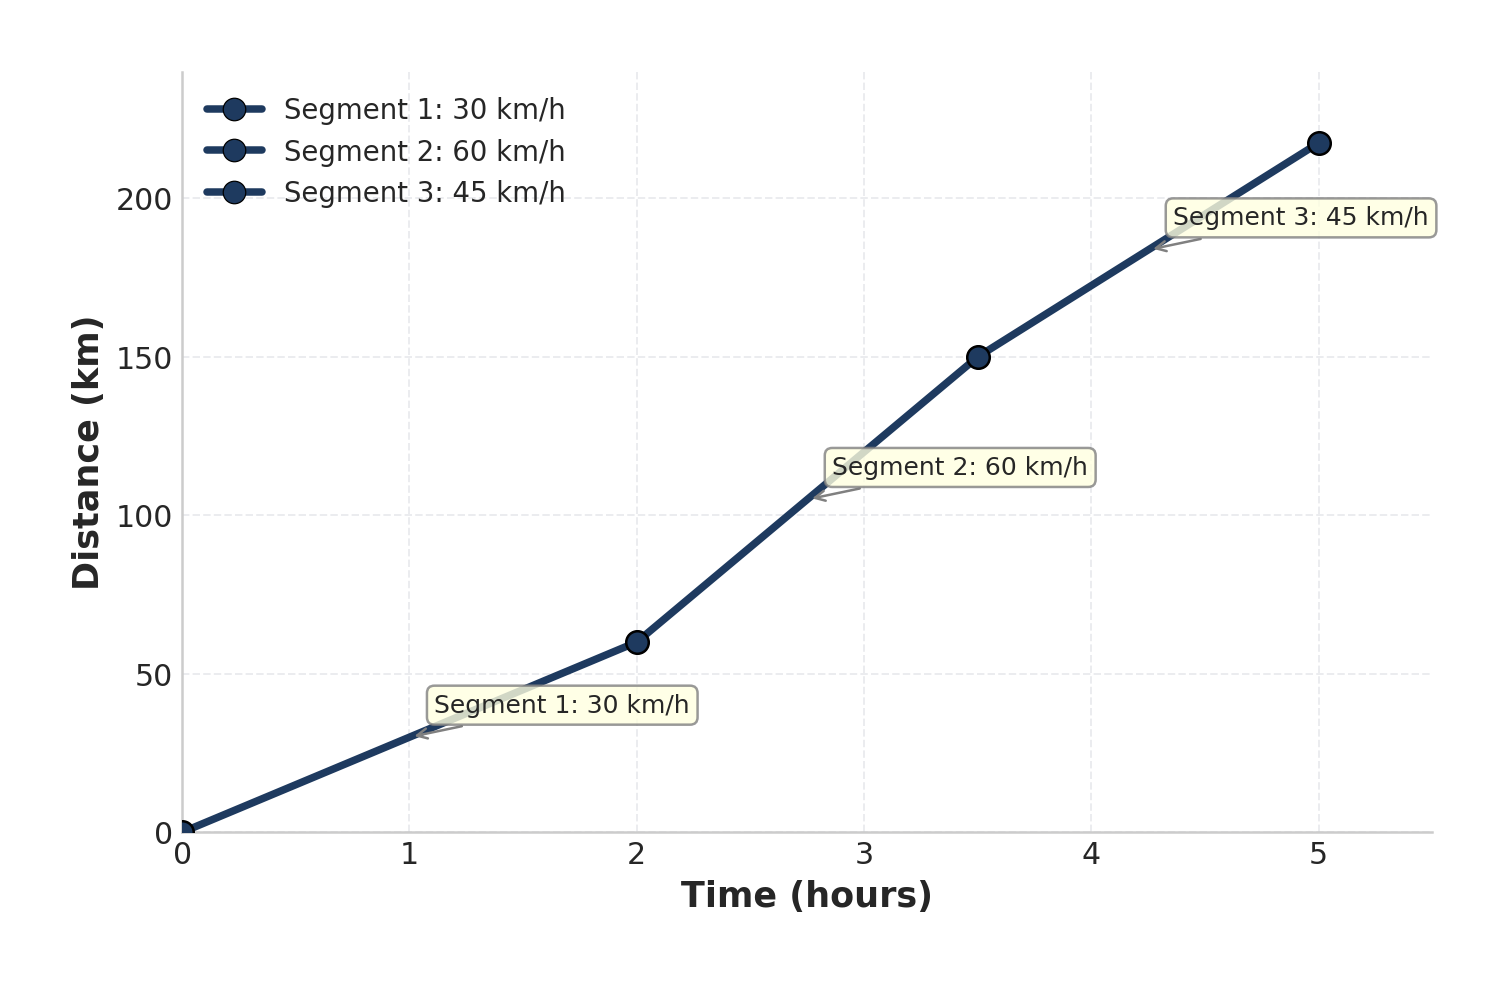
A car journey is represented by a distance–time graph with three straight-line segments.
Segment 1 ( h to h): speed km/h
Segment 2 ( h to h): speed km/h
Segment 3 ( h to h): speed km/h
The car starts at km.
Segment 1 ( h to h): speed km/h
Segment 2 ( h to h): speed km/h
Segment 3 ( h to h): speed km/h
The car starts at km.
a
Construct a table of values showing the distance at -hour intervals from h to h. [2]
b
Deduce a linear equation of the form for the distance during Segment 2. [1]
c
The driver claims the car reached km before h. Justify whether this claim is correct. [1]

Solutions
2QuestionEstimating Values and Trends from GraphsAssessment Practice
5 marks~8 minCriterion C
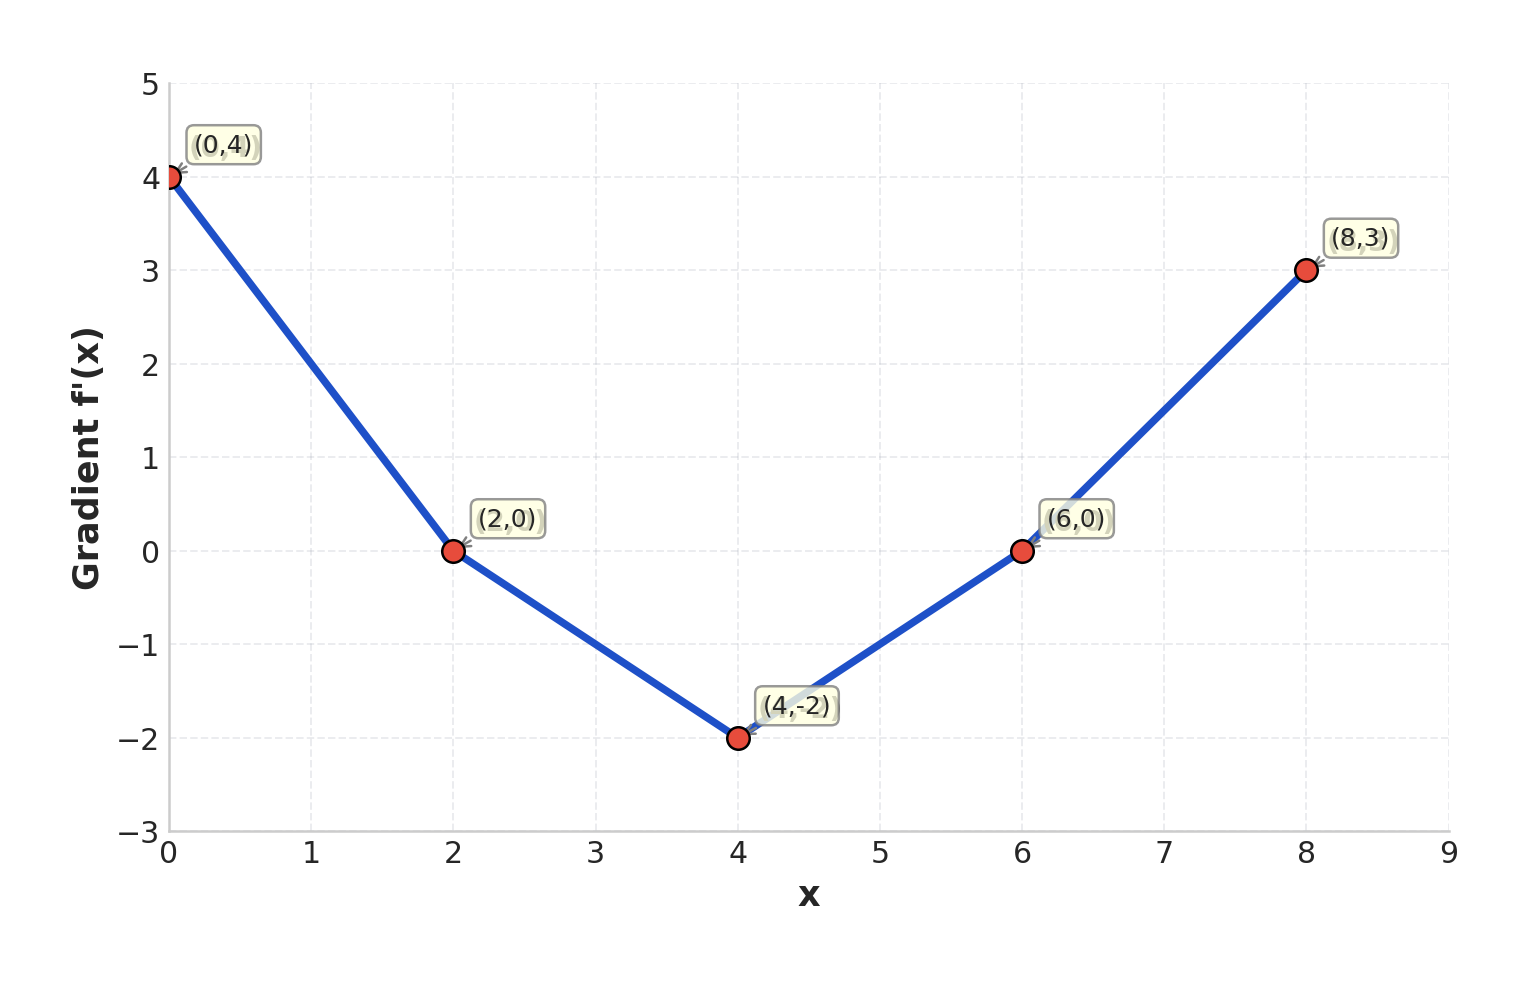
The graph shows the rate of change of a function over . The gradient graph is piecewise linear, passing through , , , , and . It is given that , and that the area between the gradient graph and the -axis from to any value equals the change in over that interval.
a
Deduce the -coordinates where has stationary points. [1]
b
Justify the classification of each stationary point as a local maximum or local minimum, using the sign of the gradient on either side. [2]
c
A designer claims that never falls below its starting value on . Assess whether this claim is correct, supporting your answer with estimated values of at the stationary points. [2]
Solutions
3QuestionReading Distance-Time GraphsAssessment Practice
6 marks~9 minCriterion D
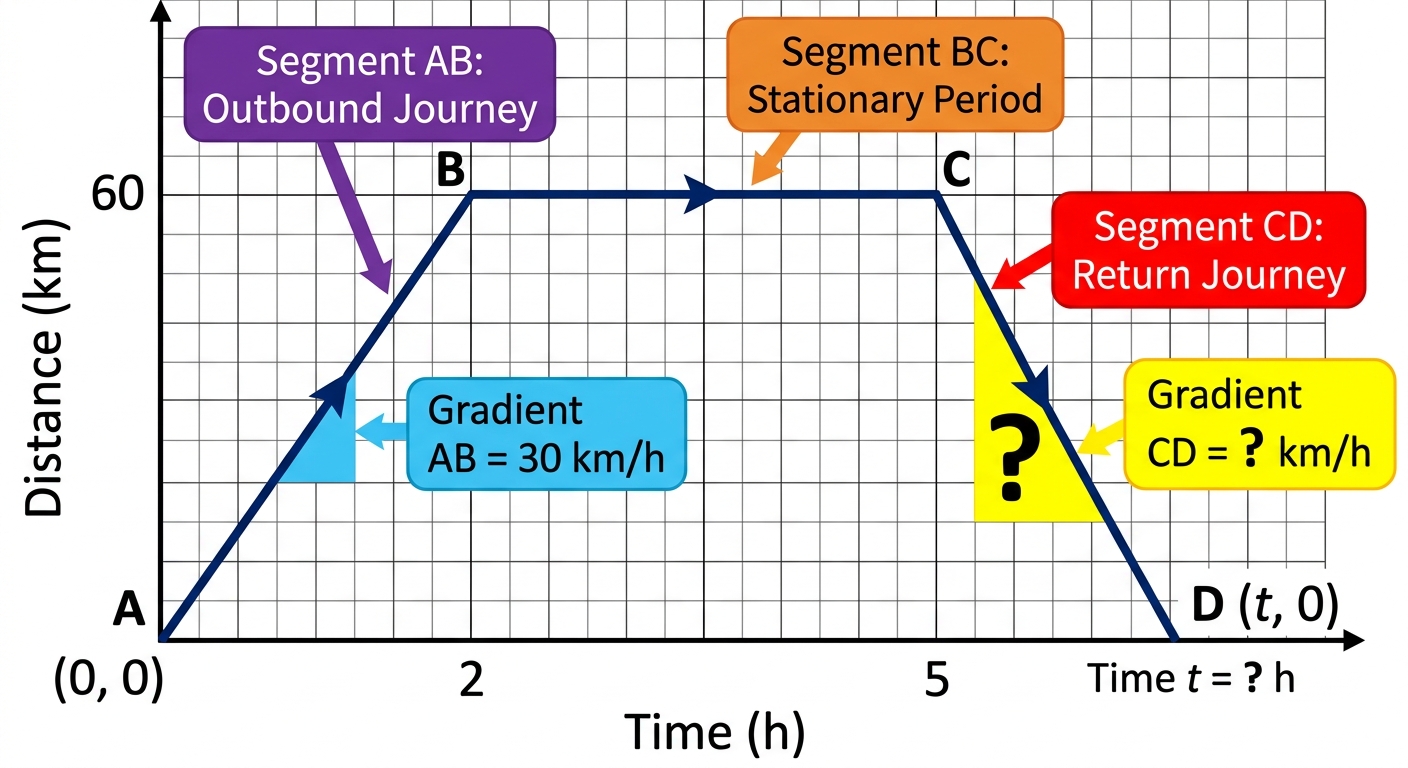
A distance–time graph shows a delivery journey from point to point with three segments:
- Segment : to
- Segment : to
- Segment : to , completed in hours
Distance is in kilometres; time is in hours.
- Segment : to
- Segment : to
- Segment : to , completed in hours
Distance is in kilometres; time is in hours.
a
Calculate the gradient of segment and the coordinates of point . [2]
b
Deduce the gradient of segment and explain what it represents in the context of this journey. [2]
c
A logistics company requires the return speed to be at least of the outbound speed. Evaluate whether this journey meets the requirement and justify your advice to the company. [2]
Solutions
That's every free question here — 3 of 38.
+35 more questions, plus Mock Papers & Worksheets, are waiting in Premium.