You're viewing free preview questions — 4 questions previewing here — subscribe to unlock 68 more, plus the Full Question Bank, Mock Papers & Worksheets.Upgrade
Box Plots Histograms and Cumulative Frequency — Free MYP4 Mathematics (Standard) Practice Questions

1QuestionConstructing and Interpreting Box PlotsConcept Practice
2 marks~3 minCriterion A
A school uses box plots to compare class performance on a standardised mathematics test.
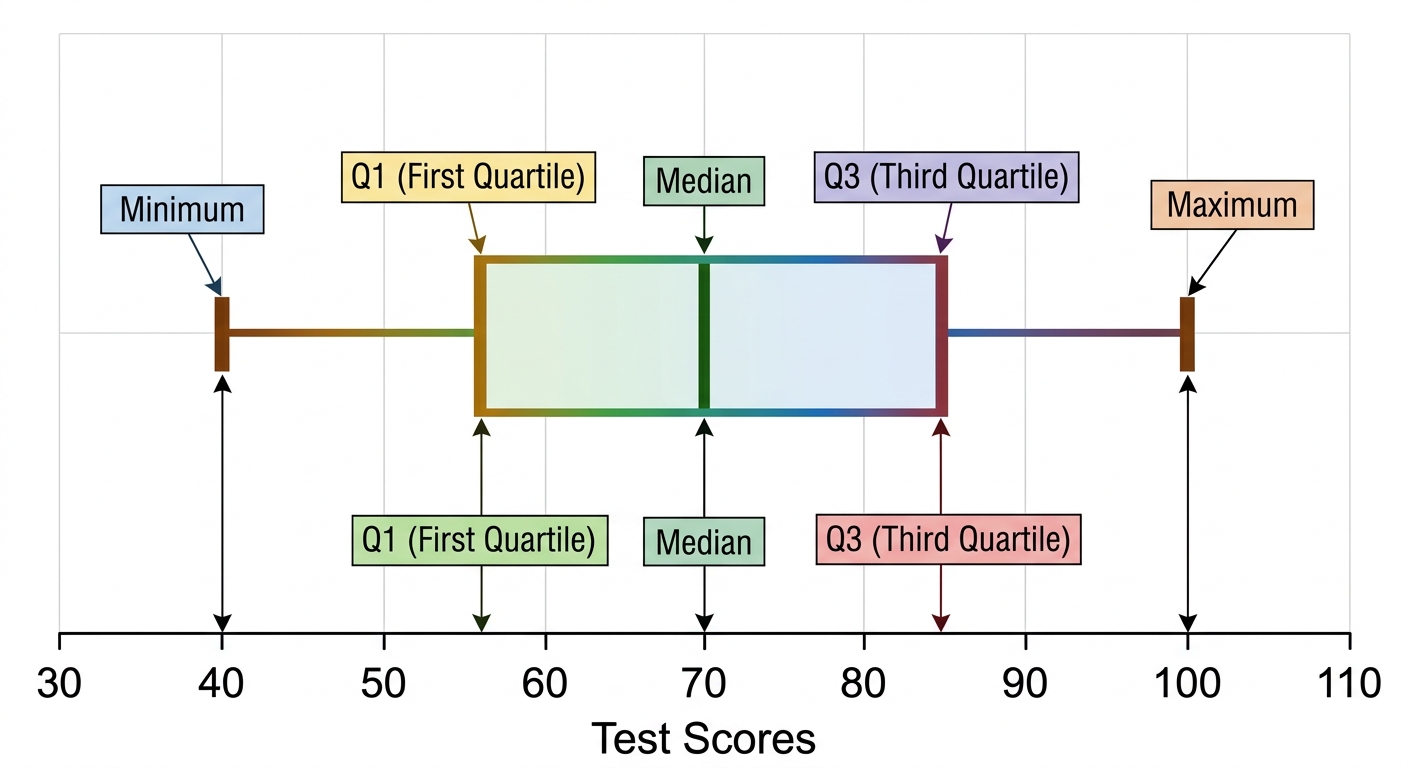
The five-number summary for Class 10B is:
Minimum , , Median , , Maximum .
The school's policy states that a class shows sufficient spread in the middle 50% of scores only if the IQR exceeds 25 marks.
The five-number summary for Class 10B is:
Minimum , , Median , , Maximum .
The school's policy states that a class shows sufficient spread in the middle 50% of scores only if the IQR exceeds 25 marks.
a
Calculate the interquartile range (IQR) for Class 10B. [1]
b
Justify whether Class 10B meets the school's policy for sufficient spread. [1]

Solutions
2QuestionCumulative Frequency Graphs and CurvesAssessment Practice
2 marks~3 minCriterion D
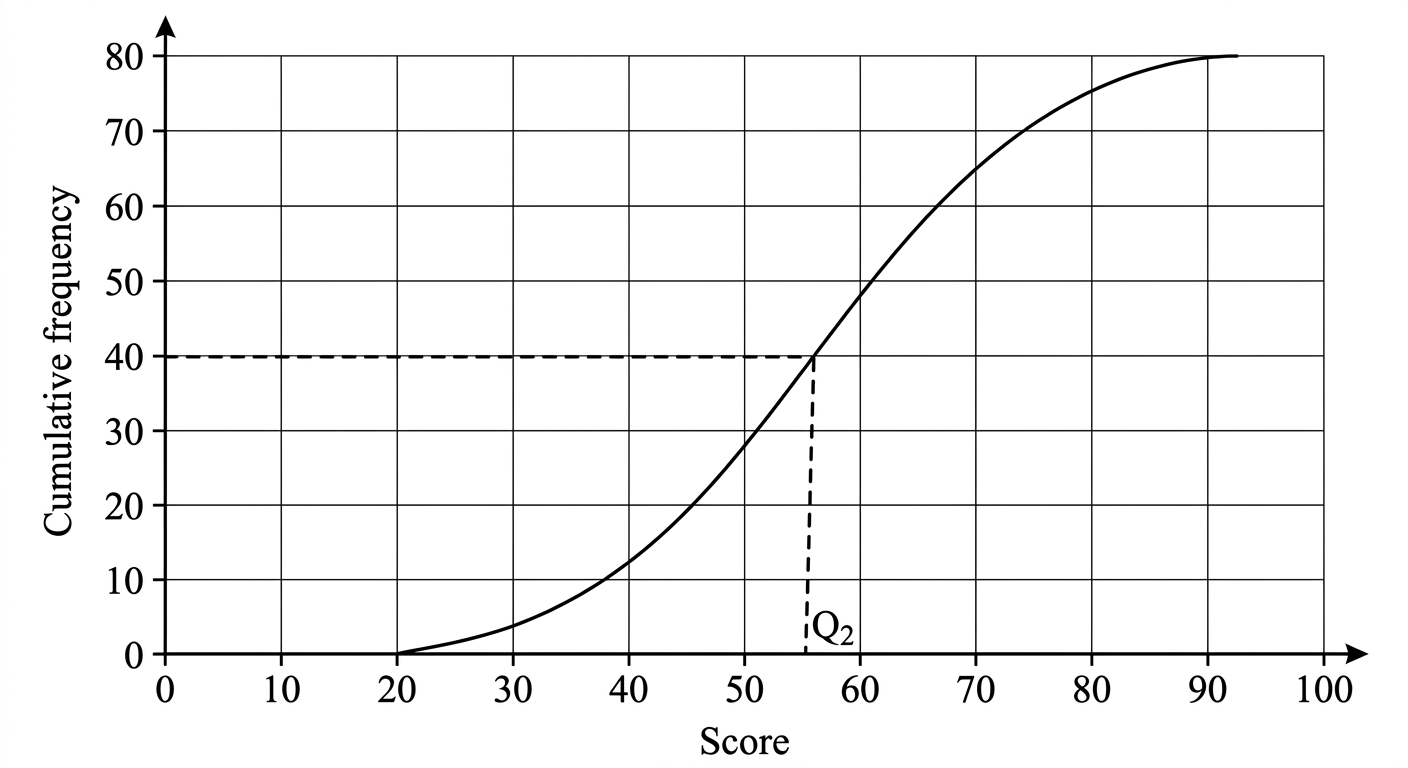
A school awards a distinction for test scores of 60 or above. The cumulative frequency curve below shows the scores of 80 students.
a
Explain how to read the median from the cumulative frequency curve, using correct mathematical notation. [1]
b
The interquartile range is used to decide whether to review the distinction threshold. Justify whether a large IQR supports or undermines confidence in the 60-point threshold. [1]
Solutions
3QuestionDrawing and Reading HistogramsAssessment Practice
6 marks~9 minCriterion C
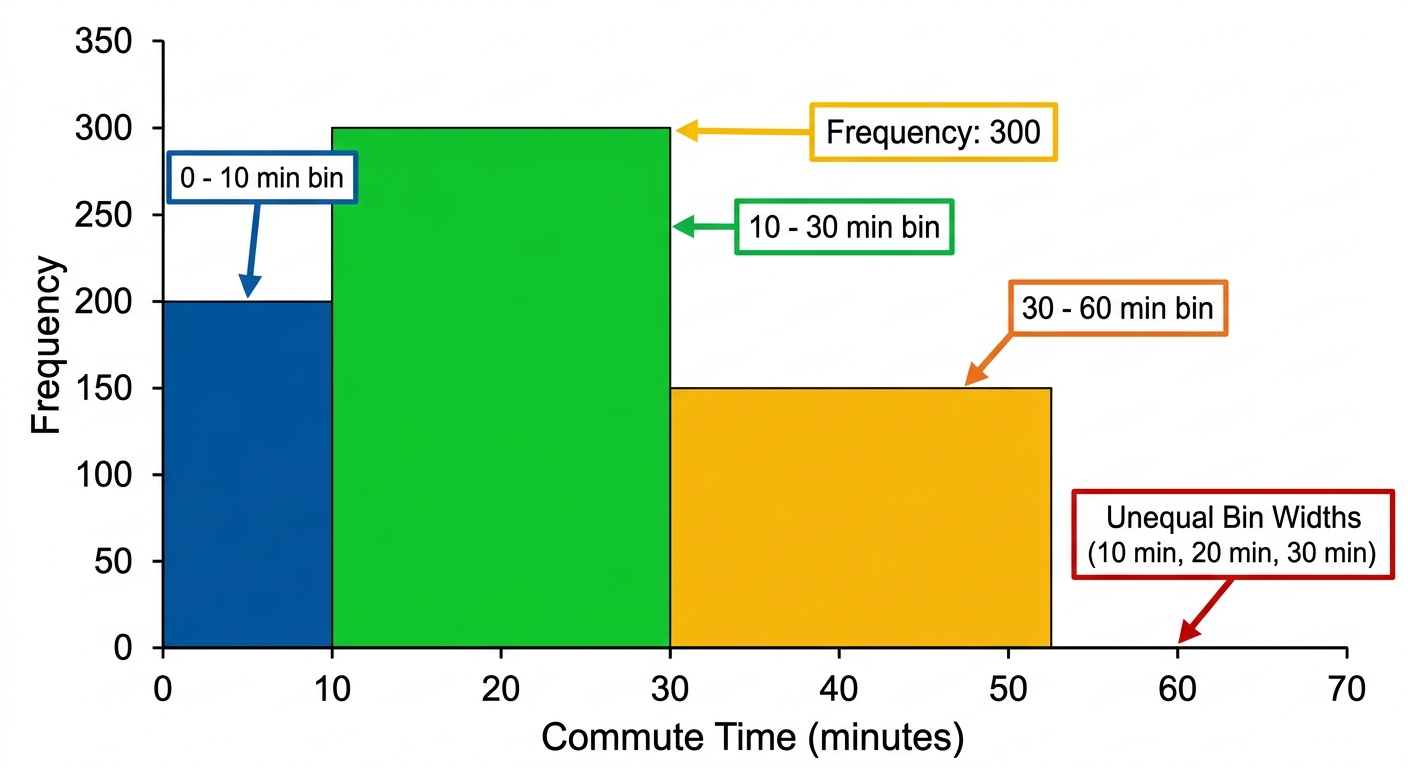
A city council presents a histogram of residents' commute times (in minutes) to justify cutting funding for a proposed bus route. The histogram uses unequal bin widths but plots raw frequency as bar height.
| Bin (minutes) | 0–10 | 10–30 | 30–60 |
|---|---|---|---|
| Frequency | 200 | 300 | 150 |
a
Calculate the frequency density for each bin. [3]
b
Explain why plotting raw frequency as bar height, rather than frequency density, produces a misleading histogram when bin widths are unequal. Refer to your values from part (a) in your answer. [1]
c
Advise the council whether this histogram provides sufficient justification for cutting the bus-route funding. In your response, identify the group of commuters most likely to benefit from the bus route, explain how the visual distortion affects the council's argument, and state one additional piece of data the council should present to support a reliable decision. [2]
Solutions
4QuestionConstructing and Interpreting Box PlotsAssessment Practice
6 marks~9 minCriterion B
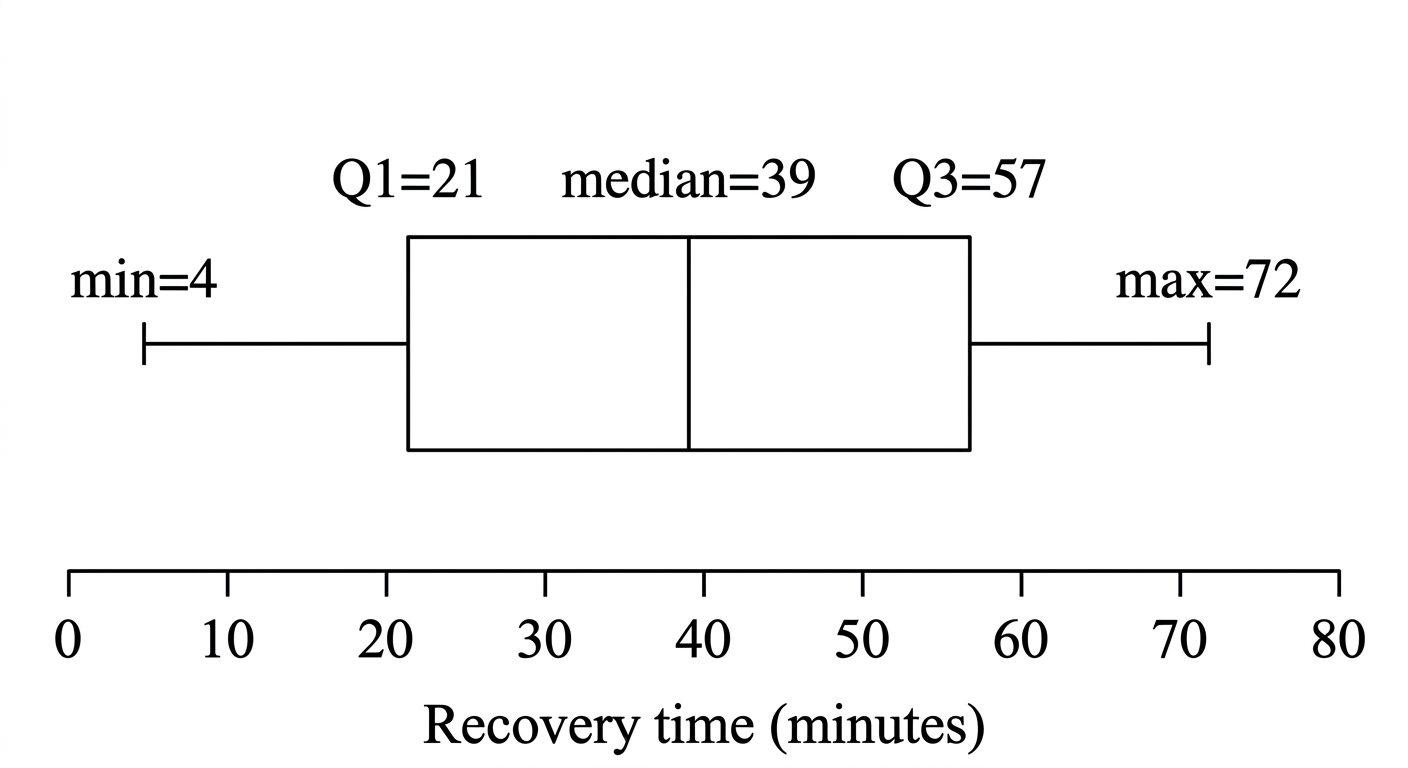
A sports analyst records the recovery times (in minutes) of 23 athletes after a training session. The ordered values are:
Quartile positions for datasets of size are given below.
: at position 2, median at position 4, at position 6
: at position 3, median at position 6, at position 9
: at position 4, median at position 8, at position 12
: at position 5, median at position 10, at position 15
Quartile positions for datasets of size are given below.
: at position 2, median at position 4, at position 6
: at position 3, median at position 6, at position 9
: at position 4, median at position 8, at position 12
: at position 5, median at position 10, at position 15
a
Deduce a general rule, in terms of , for the positions of the median, , and in an ordered dataset of values. [2]
b
Using your rules from part (a), construct the five-number summary for the 23 recovery times, showing all position calculations. [2]
c
The analyst claims that the middle 50% of athletes recover within a 36-minute window. Justify whether the interquartile range supports this claim. [2]
Solutions
That's every free question here — 4 of 72.
+68 more questions, plus Mock Papers & Worksheets, are waiting in Premium.