You're viewing free preview questions — 4 questions previewing here — subscribe to unlock 78 more, plus the Full Question Bank, Mock Papers & Worksheets.Upgrade
Experimental vs Theoretical Probability — Free MYP4 Mathematics (Standard) Practice Questions

1QuestionFairness Bias and RandomnessConcept Practice
4 marks~6 minCriterion A
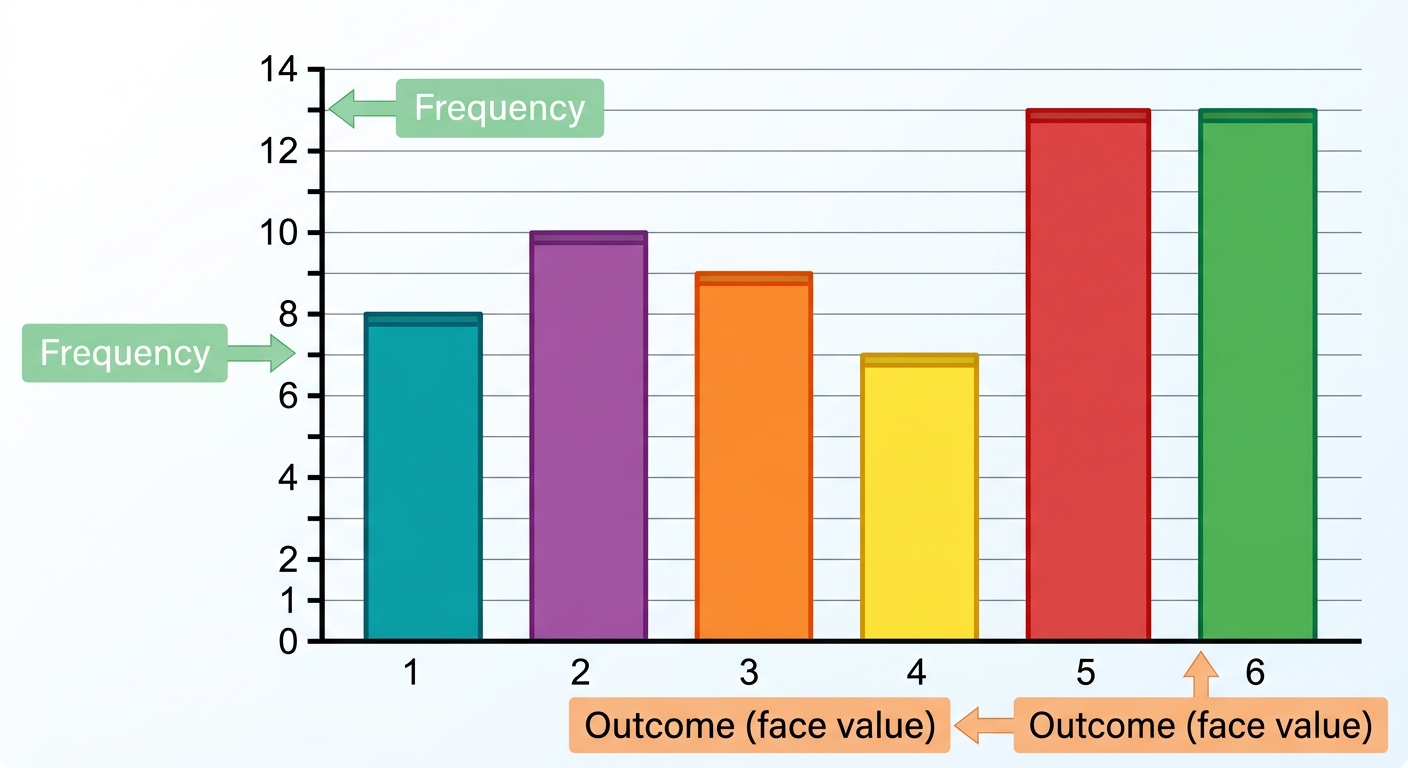
A quality-control technician suspects a six-sided die used in a board-game factory may be biased. The die is rolled 60 times with the following results.
| Outcome | 1 | 2 | 3 | 4 | 5 | 6 |
|---|---|---|---|---|---|---|
| Frequency | 8 | 10 | 9 | 7 | 13 | 13 |
a
Calculate the relative frequency of rolling a 5. [1]
b
Calculate the absolute difference between the relative frequency of rolling a 5 and its theoretical probability. [2]
c
The factory rejects any die for which the absolute difference between the relative frequency and theoretical probability of any outcome exceeds 0.08 after 60 trials. Justify whether this die should be rejected, supporting your answer with a numerical comparison. [1]

Solutions
2QuestionComparing Experimental and Expected ResultsAssessment Practice
2 marks~3 minCriterion D
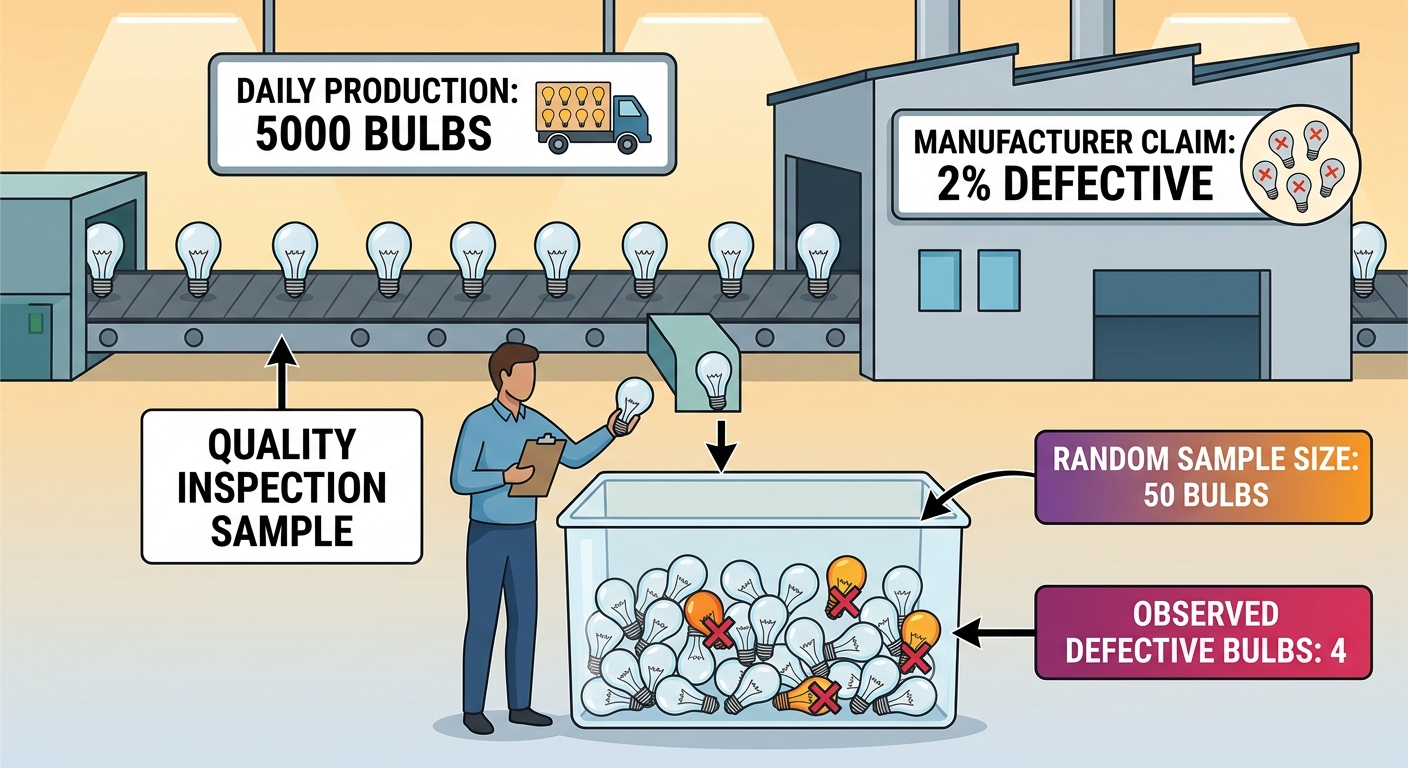
A factory produces 5000 light bulbs each day. The manufacturer claims that 2% of bulbs are defective. A quality inspector tests a random sample of 50 bulbs and finds 4 defective bulbs. The expected number of defective bulbs in the sample is .
a
Describe a real-world context in which experimental results are compared to theoretical expectations, using this scenario as an example. [1]
b
Advise the quality inspector whether the sample of 50 bulbs is sufficient to conclude that the factory's defect rate has genuinely increased beyond the manufacturer's 2% claim. [1]
Solutions
3QuestionApplications in Real-World Risk AssessmentAssessment Practice
4 marks~6 minCriterion D
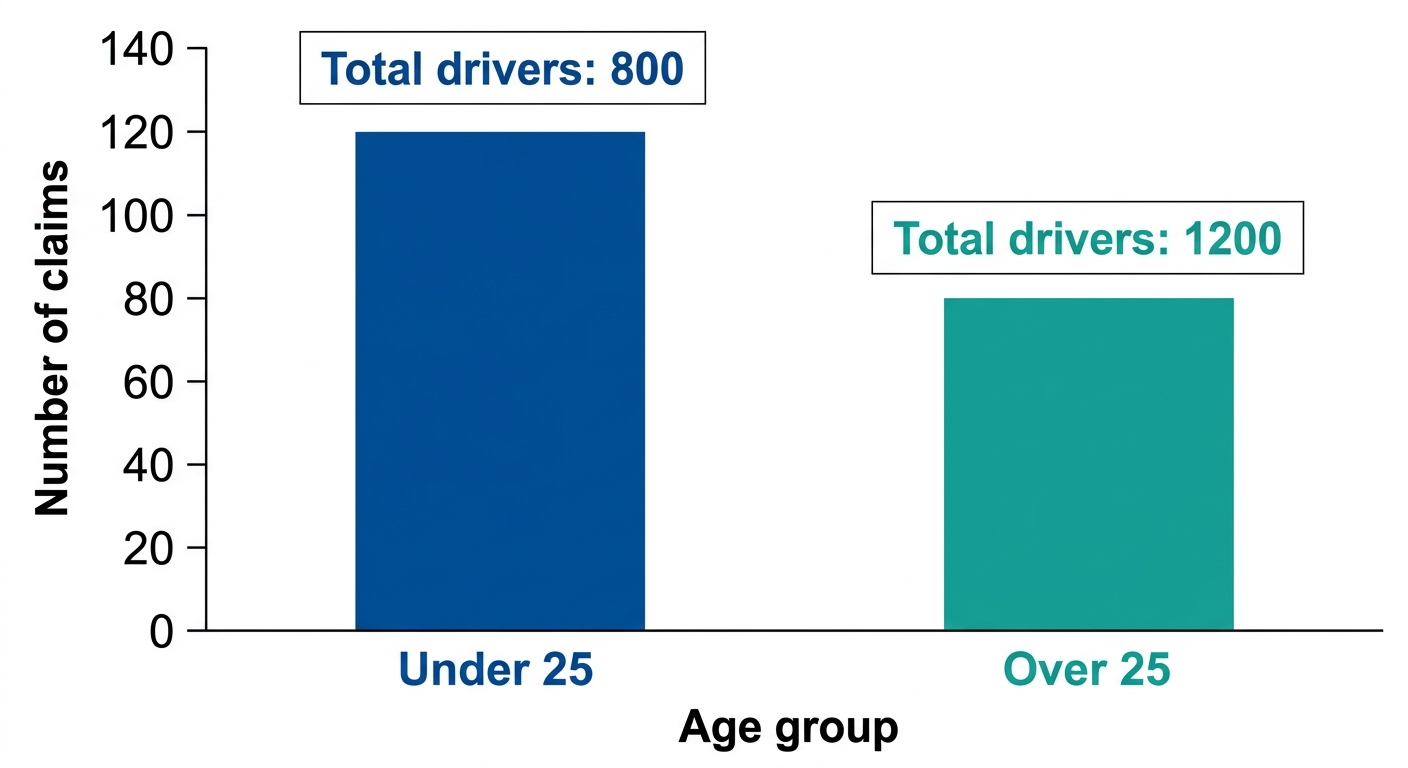
An insurance company records the following data for two groups of drivers over one year.
The relative risk of making a claim is defined as
| Age group | Under 25 — claims: 120 | total drivers: 800 |
|---|---|---|
| Age group | Over 25 — claims: 80 | total drivers: 1200 |
The relative risk of making a claim is defined as
a
Calculate and . [2]
b
Calculate the relative risk of making a claim for drivers under 25 compared to drivers over 25. [1]
c
The insurance company charges drivers under 25 a premium 2.5 times higher than drivers over 25. Justify whether this premium multiplier is supported by the claim data. [1]
Solutions
4QuestionRelative Frequency and Long-Term TrendsAssessment Practice
6 marks~9 minCriterion C
A quality-control analyst at a board-game manufacturer tests whether a six-sided die is fair. She rolls the die 60 times and records that the face showing 4 appears 8 times.
a
Calculate the relative frequency of rolling a 4 from these 60 trials. [1]
b
Deduce the expected number of times a 4 should appear in 60 rolls of a fair die, and explain what the difference between this value and the observed count reveals about experimental and theoretical probability. [2]
c
The analyst concludes: "60 rolls is not enough evidence to declare the die unfair; I need far more trials." Justify whether her conclusion is mathematically sound, using the law of large numbers to support your reasoning. [3]
Solutions
That's every free question here — 4 of 82.
+78 more questions, plus Mock Papers & Worksheets, are waiting in Premium.