You're viewing free preview questions — 4 questions previewing here — subscribe to unlock 69 more, plus the Full Question Bank, Mock Papers & Worksheets.Upgrade
Measures of Dispersion — Free MYP4 Mathematics (Standard) Practice Questions

1QuestionStem and Leaf PlotsConcept Practice
3 marks~5 minCriterion A
A school uses a minimum median score of 72 to determine whether a class needs additional support. The stem-and-leaf plot below shows the test scores (out of 100) of 15 students.
Key: represents a score of 45.
Key: represents a score of 45.
a
Calculate the median test score. [1]
b
Deduce the position of the median in this data set, showing the method used to identify it. [1]
c
Justify whether this class requires additional support, with reference to the school's criterion of 72. [1]

Solutions
2QuestionComparing Variability Between Data SetsAssessment Practice
3 marks~5 minCriterion C
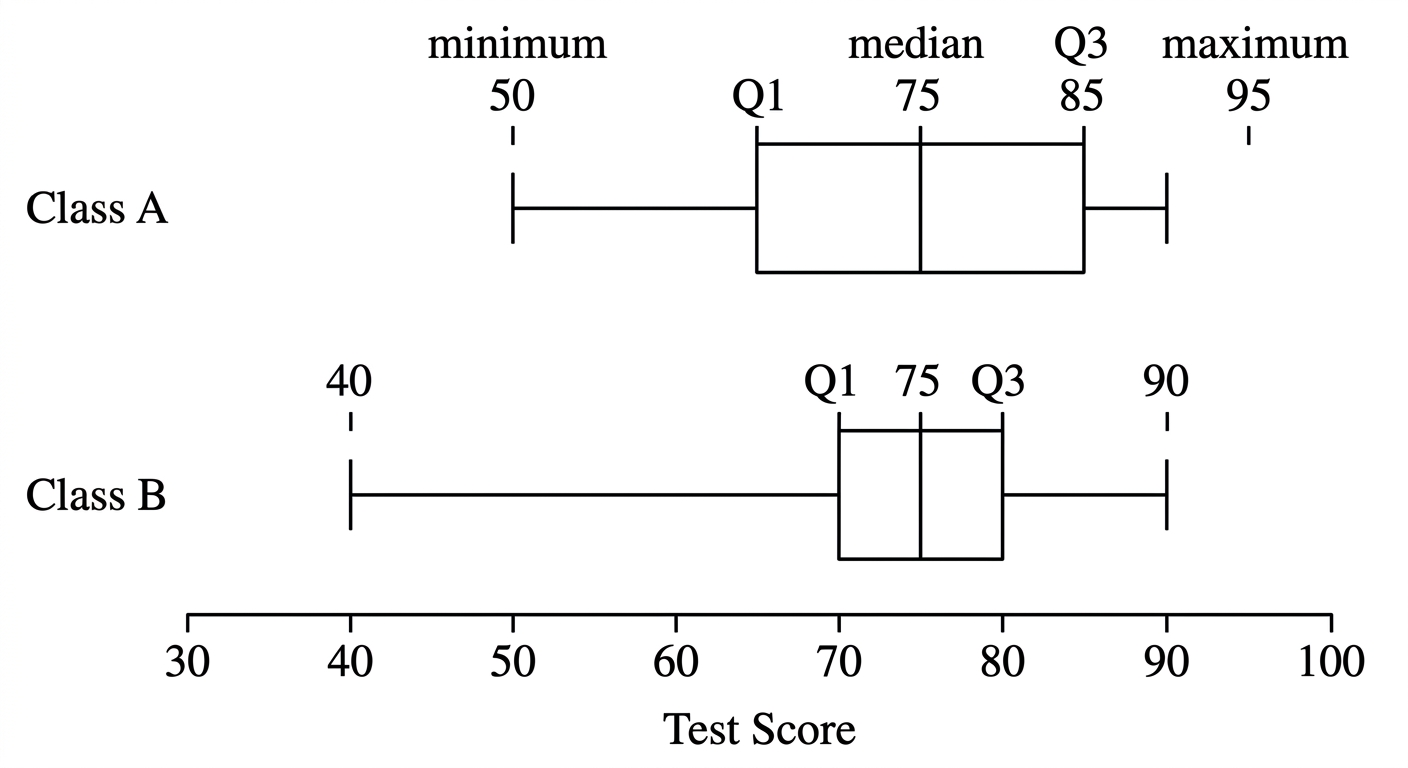
A mathematics coordinator is reviewing test performance across two classes to decide whether to report variability using the range or the interquartile range (IQR) in the end-of-year report.
The five-number summaries are:
Class A: Minimum , , Median , , Maximum
Class B: Minimum , , Median , , Maximum
The five-number summaries are:
Class A: Minimum , , Median , , Maximum
Class B: Minimum , , Median , , Maximum
a
Calculate the range and IQR for each class. [1]
b
Explain which measure of dispersion — range or IQR — better represents the variability of scores for each class, referring to your values from part (a). [1]
c
The coordinator states: "Both classes show similar variability in student performance." Assess whether this statement is supported or contradicted by the data, referring to an appropriate measure of dispersion. [1]
Solutions
3QuestionComparing Variability Between Data SetsAssessment Practice
8 marks~12 minCriterion D
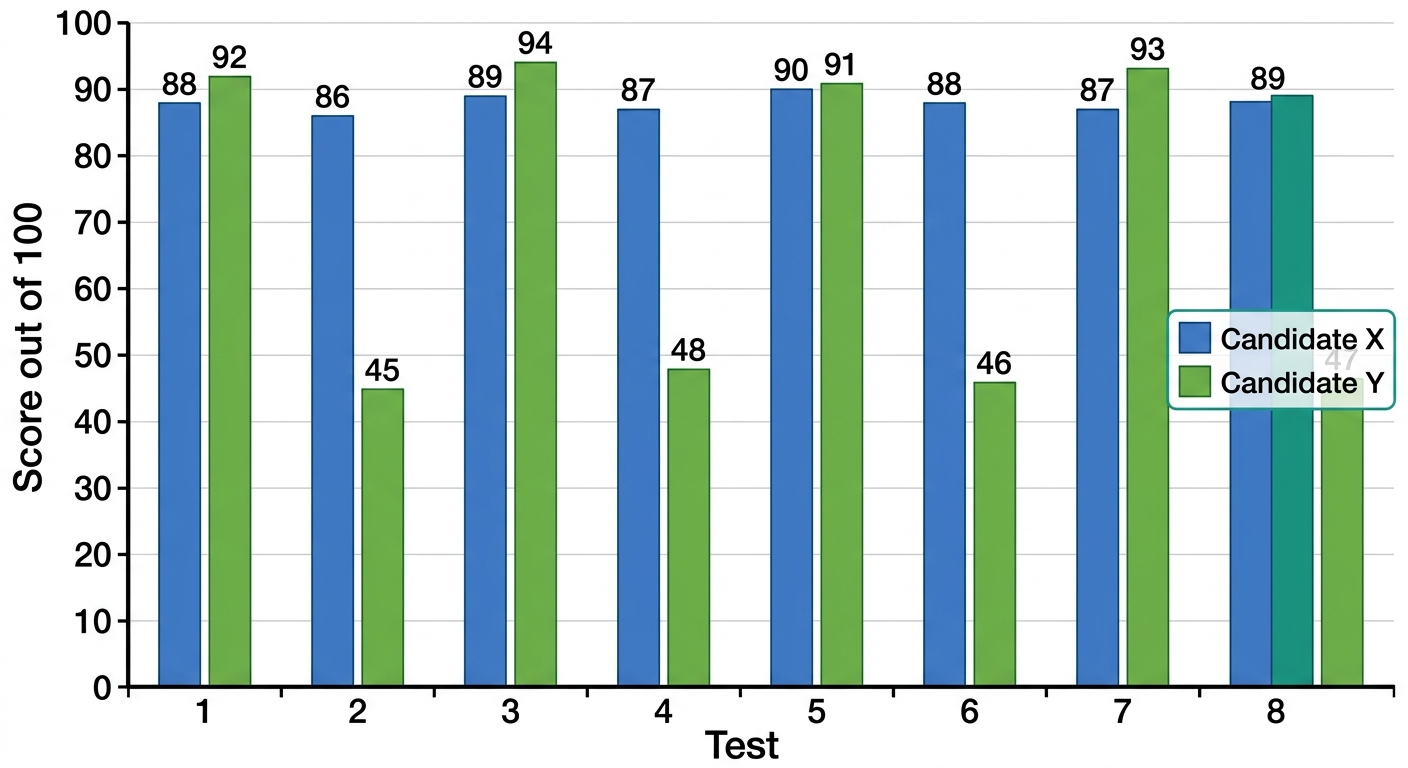
A school awards a scholarship to the candidate who performs most consistently across eight tests, each marked out of 100. Two finalists have the following scores, recorded in the order the tests were taken.
Candidate X: 85, 88, 82, 90, 86, 84, 89, 84
Candidate Y: 95, 75, 98, 72, 94, 78, 92, 76
Candidate X: 85, 88, 82, 90, 86, 84, 89, 84
Candidate Y: 95, 75, 98, 72, 94, 78, 92, 76
a
Calculate the mean and population standard deviation for each candidate. Show all working. [4]
b
Deduce which candidate demonstrates greater consistency. Justify your answer using both measures calculated in part (a). [2]
c
Advise the scholarship panel whether standard deviation alone provides a sufficient basis for their decision, given that the scores are recorded in the order the tests were taken. [2]
Solutions
4QuestionRange and Interquartile RangeAssessment Practice
8 marks~12 minCriterion B
A city's air-quality monitoring network records daily fine-particle counts (µg/m³) at five sensors. On days following an industrial emission event, the highest reading rises progressively while the other four remain fixed:
Day 1:
Day 2:
Day 3:
Day 4:
Day 5:
Day 1:
Day 2:
Day 3:
Day 4:
Day 5:
a
Calculate the range and interquartile range (IQR) for each of the five datasets. [2]
b
Deduce the range and IQR for the dataset , justifying your answer using the pattern observed in part (a). [2]
c
Calculate the range and IQR for the dataset and verify whether your deduction in part (b) is correct. [2]
d
The health authority uses the IQR, not the range, to assess whether air-quality readings are "stable" across sensors. Advise the health authority whether this choice is sufficient for reliable stability assessment, using your results to support your recommendation. [2]
Solutions
That's every free question here — 4 of 73.
+69 more questions, plus Mock Papers & Worksheets, are waiting in Premium.