You're viewing free preview questions — 5 questions previewing here — subscribe to unlock 127 more, plus the Full Question Bank, Mock Papers & Worksheets.Upgrade
Motion Graphs Distance-Time and Speed-Time — Free MYP4 Physics Practice Questions

1QuestionInterpreting Distance-Time GraphsConcept Practice
2 marks~3 minCriterion A
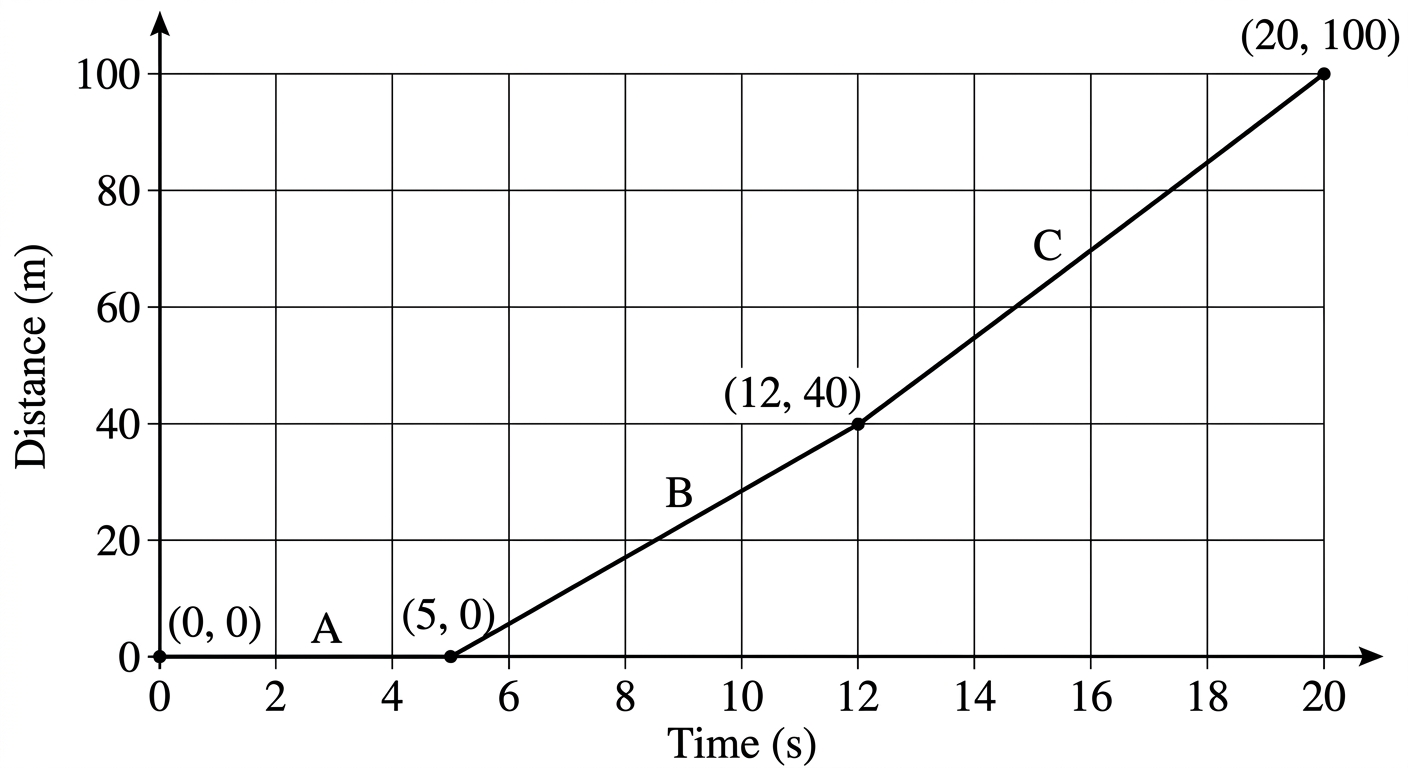
A runner's motion over 20 seconds is shown in the distance–time graph below.
Segment A: 0–5 s, horizontal at 0 m.
Segment B: 5–12 s, rises from 0 m to 40 m.
Segment C: 12–20 s, rises from 40 m to 100 m.
Segment A: 0–5 s, horizontal at 0 m.
Segment B: 5–12 s, rises from 0 m to 40 m.
Segment C: 12–20 s, rises from 40 m to 100 m.
a
State the speed of the runner during Segment A. [1]
b
Deduce which segment, B or C, represents faster motion. Support your answer with calculated speeds. [1]

Solutions
2QuestionInterpreting Distance-Time GraphsAssessment Practice
5 marks~8 minCriterion A
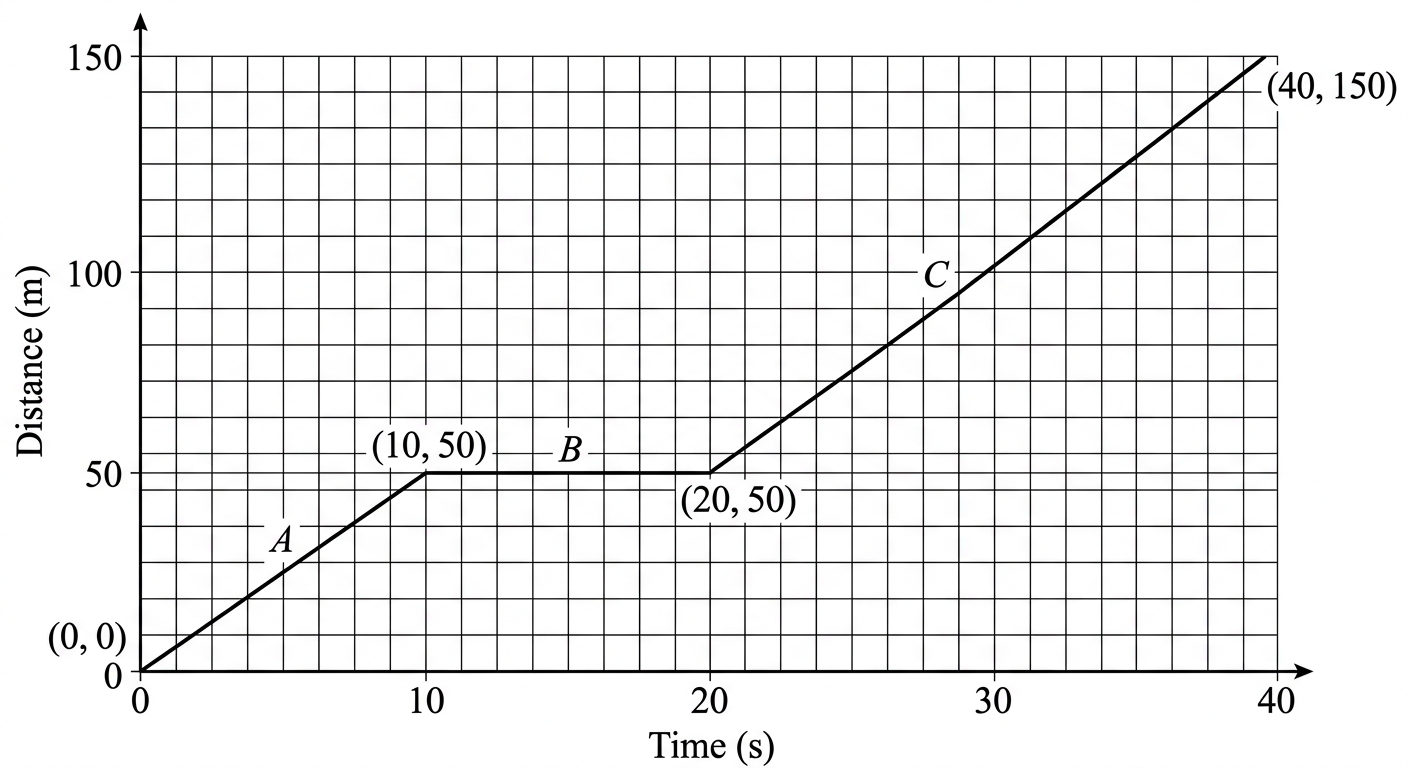
A cyclist's motion over 40 seconds is shown in the distance–time graph below.
Segment A: s to s, distance increases from 0 m to 50 m.
Segment B: s to s, distance remains constant at 50 m.
Segment C: s to s, distance increases from 50 m to 150 m.
Segment A: s to s, distance increases from 0 m to 50 m.
Segment B: s to s, distance remains constant at 50 m.
Segment C: s to s, distance increases from 50 m to 150 m.
a
Deduce the speed of the cyclist during Segment A. [1]
b
Interpret what the gradient of Segment B tells you about the cyclist's motion, and calculate the speed during Segment C. [2]
c
Analyse how the gradients of Segments A and C compare, and evaluate what this reveals about the cyclist's motion across the full 40 seconds. [2]
Solutions
3QuestionInterpreting Speed-Time GraphsAssessment Practice
8 marks~12 minCriterion D
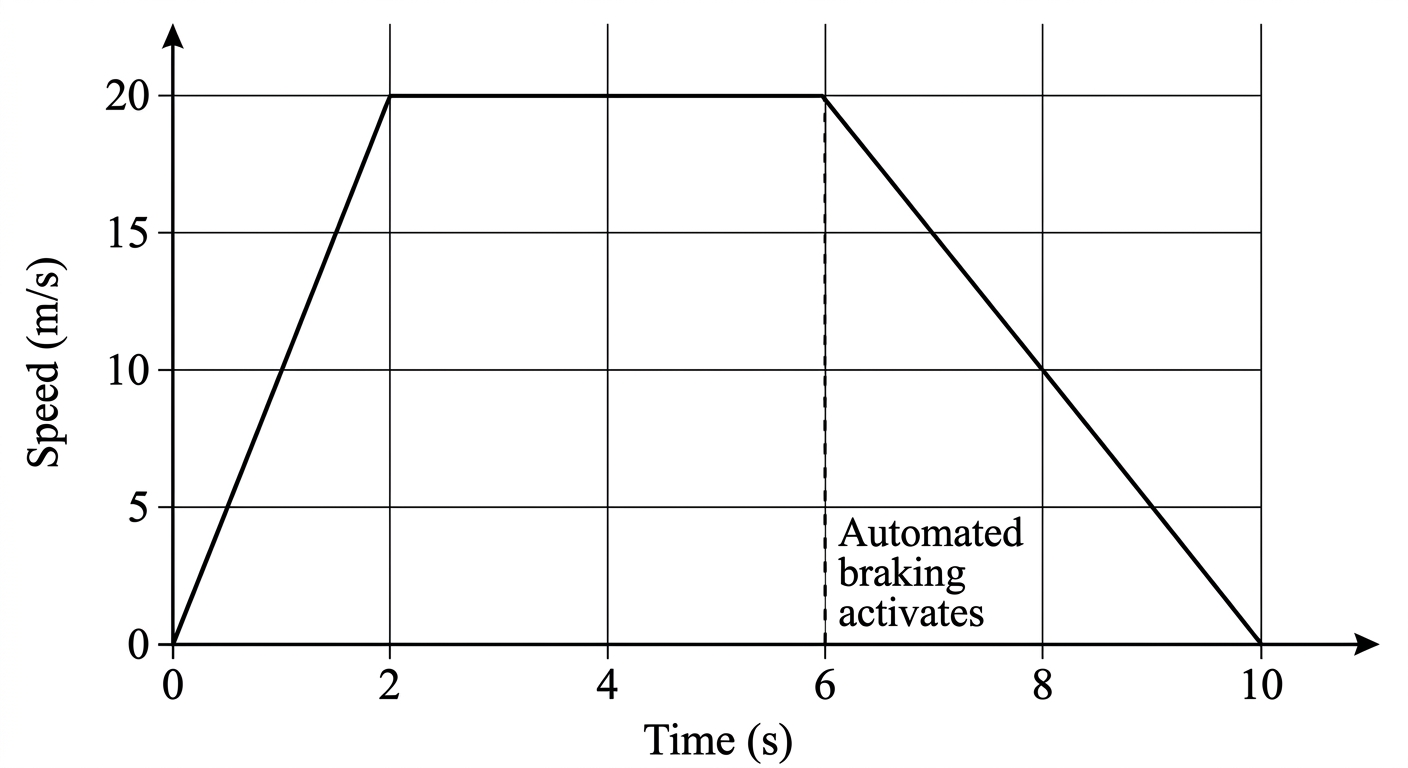
A car approaches a traffic intersection equipped with an automated braking system. The speed-time graph below shows the car's motion over 10 seconds. The automated system activates at , when the car is exactly 50 m from the intersection.
a
Interpret the motion of the car during each time interval: to , to , and to . [3]
b
Calculate the distance the car travels between and , and deduce whether the car stops before reaching the intersection. [2]
c
Evaluate the effectiveness of the automated braking system, using evidence from the graph and considering reaction time, deceleration, and sensor reliability. [3]
Solutions
4QuestionDescribing Motion Qualitatively and QuantitativelyAssessment Practice
8 marks~12 minCriterion D
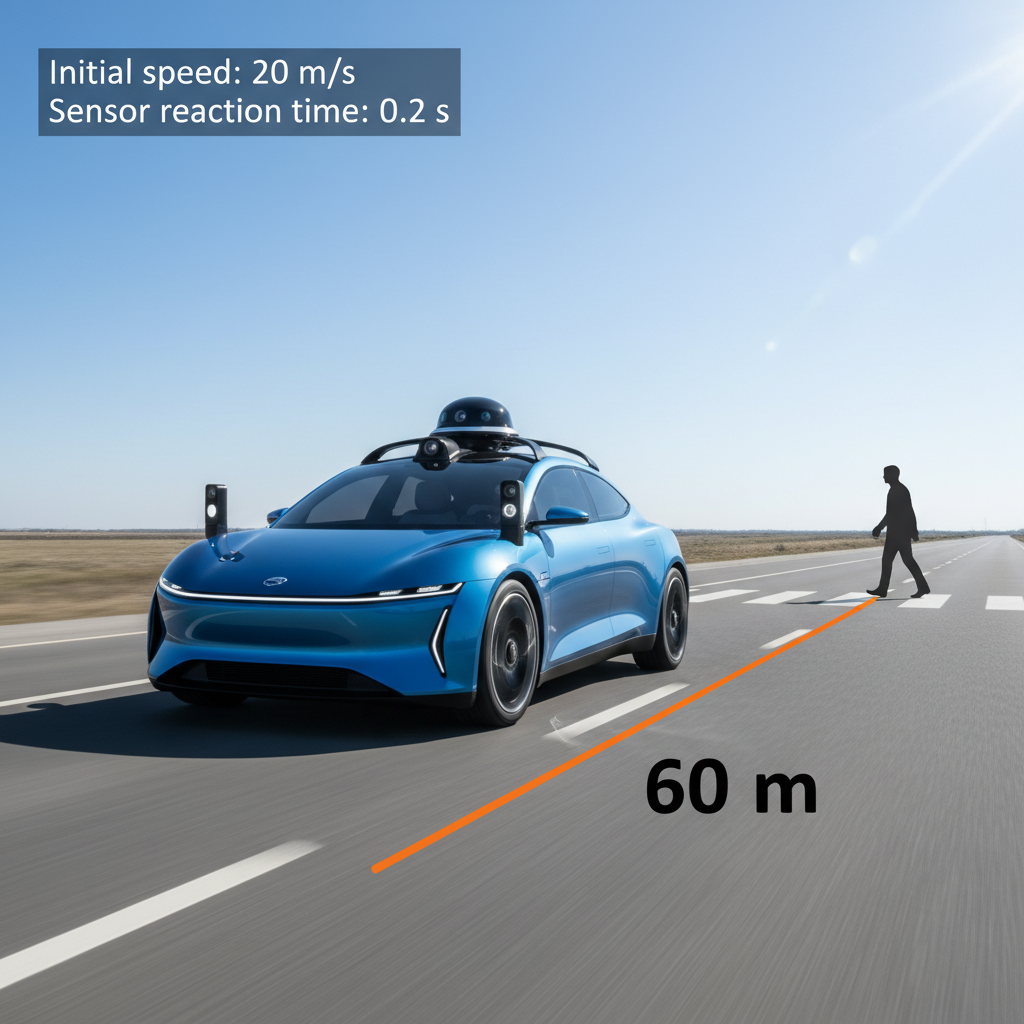
A self-driving car travels at when a pedestrian steps into the road ahead. The sensor system has a reaction time of before braking begins. Two braking profiles are available: a smooth profile with constant deceleration , and an emergency profile with constant deceleration .
a
Calculate the total stopping distance for the smooth braking profile. Use to find the braking distance. [3]
b
Deduce, using a calculation for the emergency profile, which braking profile prevents a collision. [3]
c
Evaluate whether programming the smooth profile as the default is ethically justifiable, considering how risk is distributed between passengers and pedestrians and how real-world conditions affect the reliability of the stopping-distance model. [2]
Solutions
5QuestionCalculating Acceleration and Area Under GraphsAssessment Practice
8 marks~12 minCriterion C
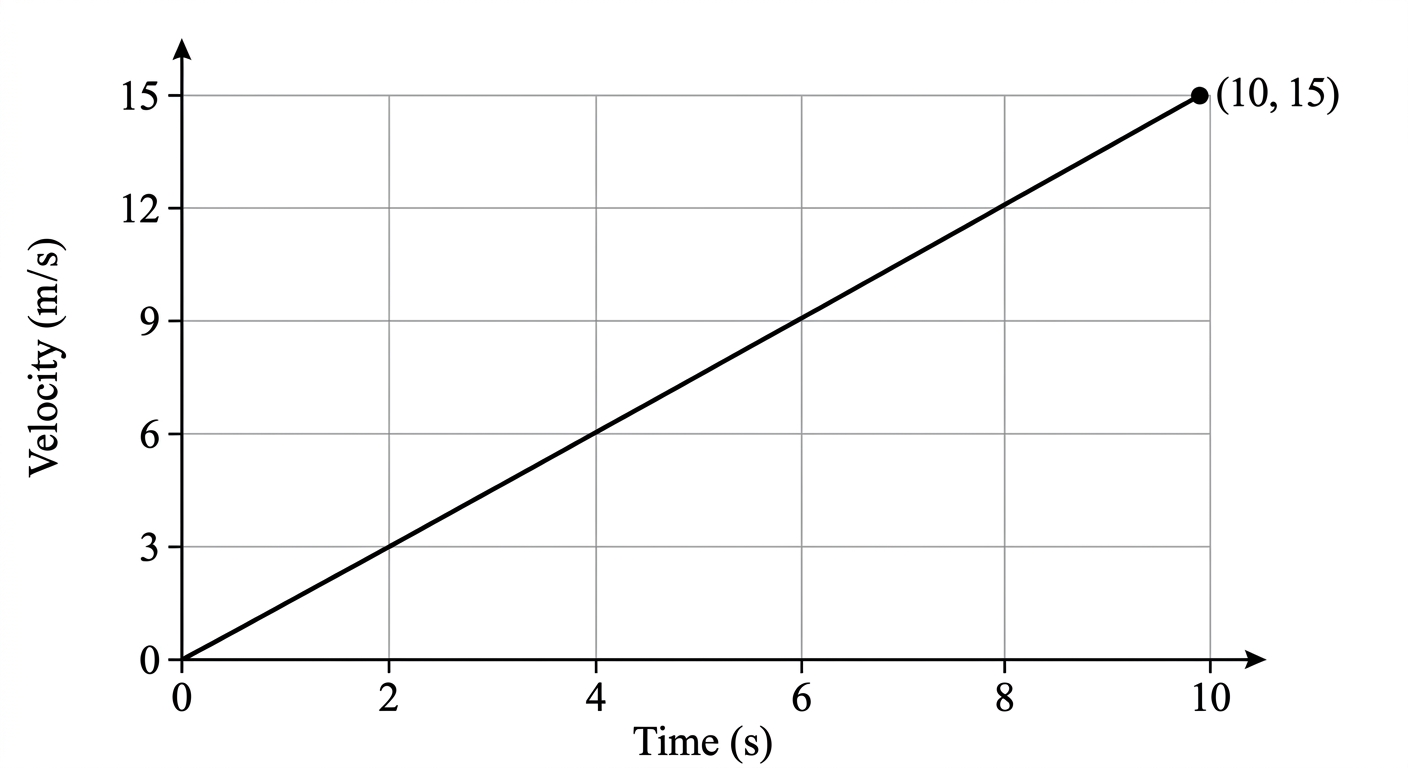
A cyclist starts from rest and accelerates uniformly from rest along a straight road. The velocity–time graph below shows the cyclist's motion over 10 seconds. Air resistance is negligible.
a
Deduce the cyclist's acceleration during the first 6 seconds. [2]
b
The cyclist's coach claims that the acceleration is constant throughout the entire 10 seconds. Justify this claim using values calculated from the graph. [2]
c
A second cyclist travels the same 10-second journey at a constant velocity equal to the average velocity of the first cyclist. Analyse which cyclist covers more distance, and explain what this reveals about the motion of the first cyclist. [4]
Solutions
That's every free question here — 5 of 132.
+127 more questions, plus Mock Papers & Worksheets, are waiting in Premium.