You're viewing free preview questions — 5 questions previewing here — subscribe to unlock 117 more, plus the Full Question Bank, Mock Papers & Worksheets.Upgrade
Enzymes and Metabolism — Free MYP5 Biology Practice Questions

1QuestionDenaturation and pH/Temperature EffectsConcept Practice
2 marks~3 minCriterion A
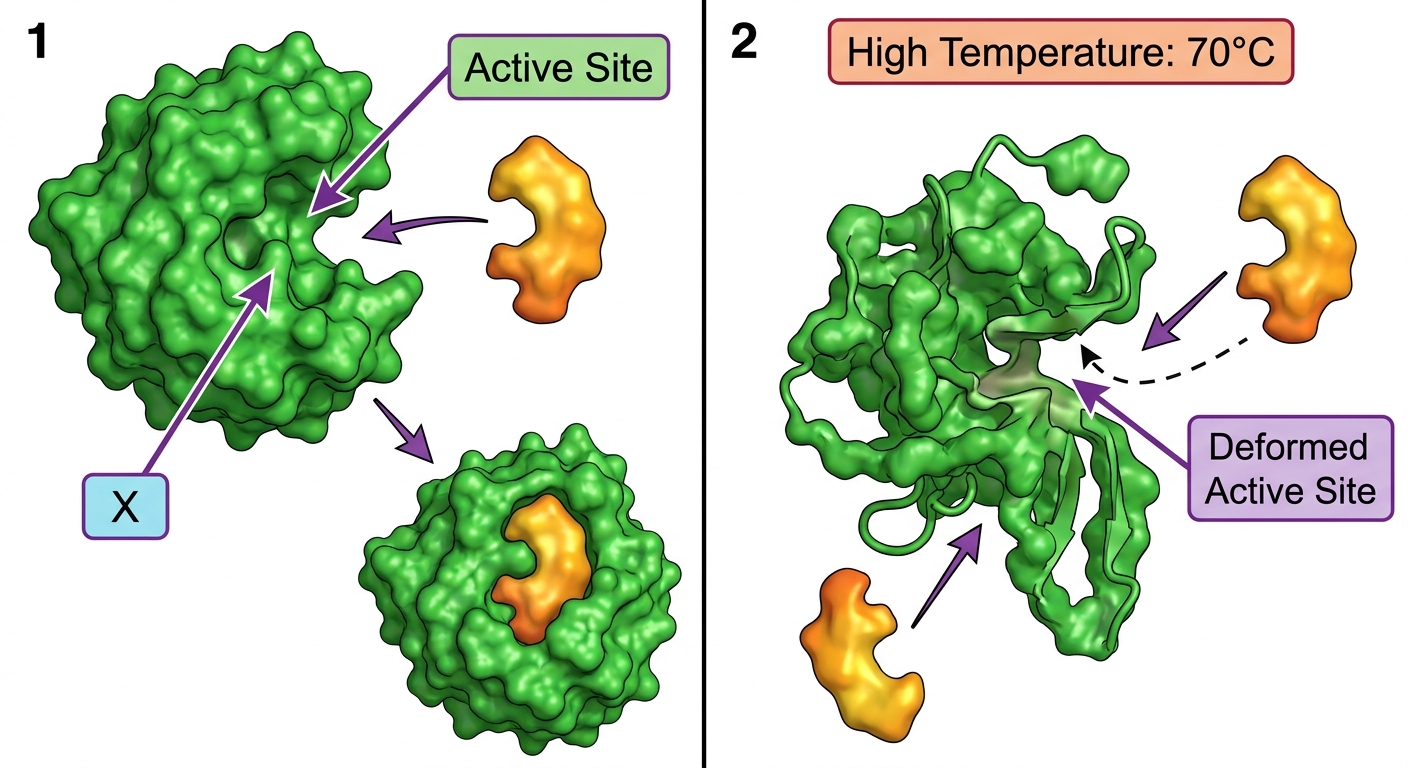
Two diagrams show the same enzyme. In Diagram 1, the enzyme functions normally at 37 °C, and structure X is clearly labelled. In Diagram 2, the enzyme is exposed to 70 °C; its shape has visibly changed and the substrate can no longer bind.
a
Identify structure X. [1]
b
Explain what has happened to the enzyme in Diagram 2 and why the substrate can no longer bind. [1]

Solutions
2QuestionDenaturation and pH/Temperature EffectsAssessment Practice
2 marks~3 minCriterion D
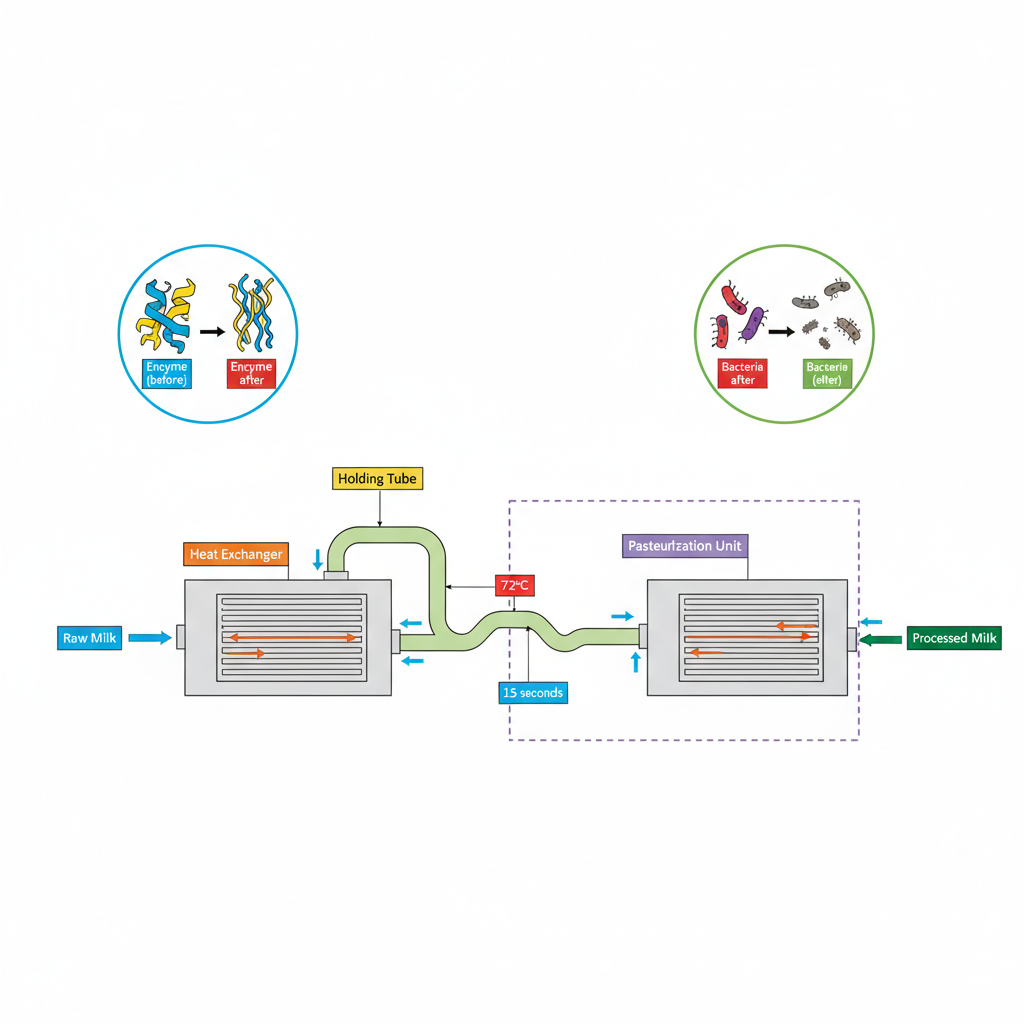
A food company pasteurizes milk at for 15 seconds to eliminate harmful bacteria. At this temperature, enzymes naturally present in the milk are denatured — their active sites permanently change shape — which may alter the milk's taste and nutritional properties.
Identify and explain one ethical issue the company should consider when deciding whether to use this pasteurization temperature. [2]
Identify and explain one ethical issue the company should consider when deciding whether to use this pasteurization temperature. [2]
Solutions
3QuestionFactors Affecting Enzyme ActivityAssessment Practice
4 marks~6 minCriterion A
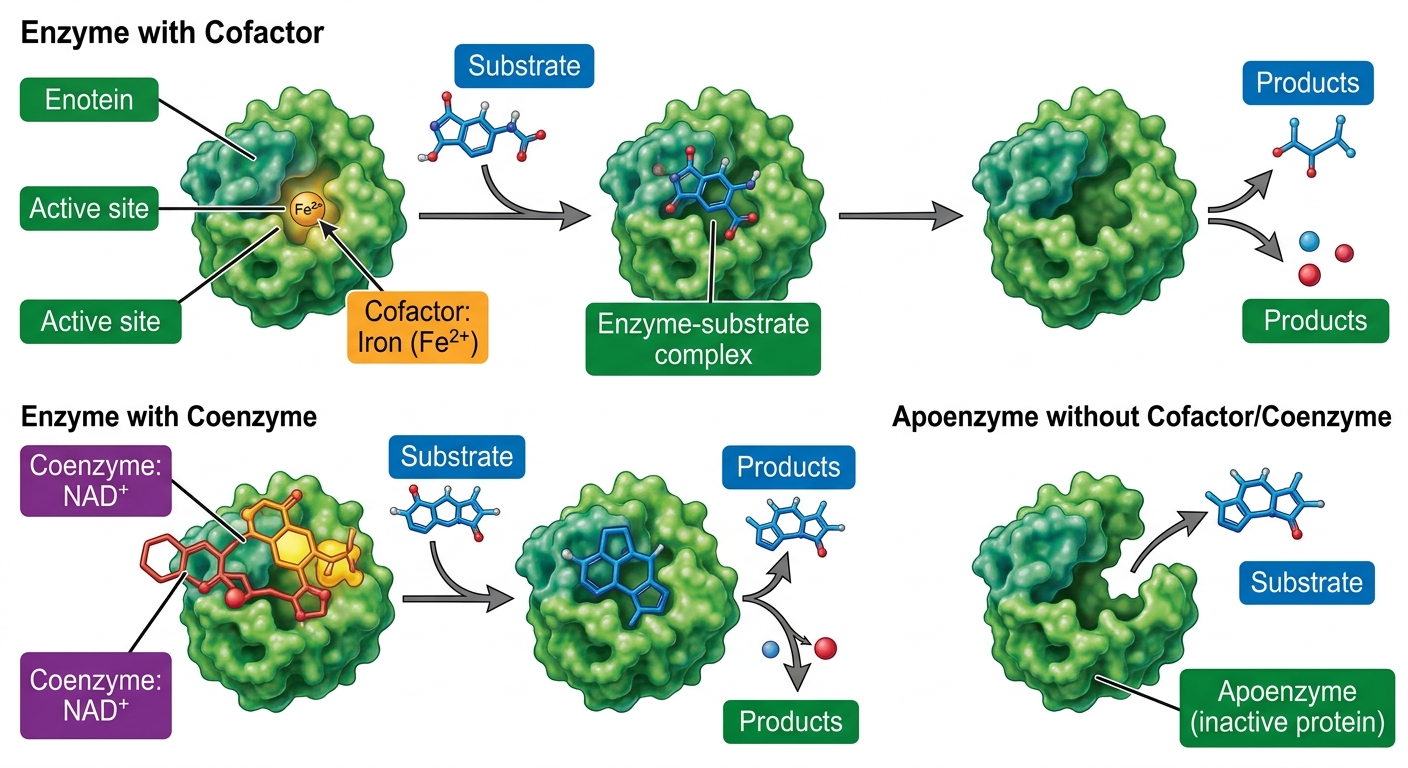
A student investigates the effect of a metal-ion cofactor on enzyme activity. In the presence of the cofactor , the enzyme catalyses its reaction efficiently. When is removed by adding a chelating agent, the reaction rate falls sharply. The student proposes that the cofactor is essential for maintaining the functional shape of the active site.
a
State the difference between a cofactor and a coenzyme. [1]
b
Explain how enables the enzyme to catalyse its reaction effectively. [1]
c
Analyse how the removal of affects the active site and, using this, account for the sharp fall in reaction rate observed by the student. [2]
Solutions
4QuestionFactors Affecting Enzyme ActivityAssessment Practice
4 marks~6 minCriterion A
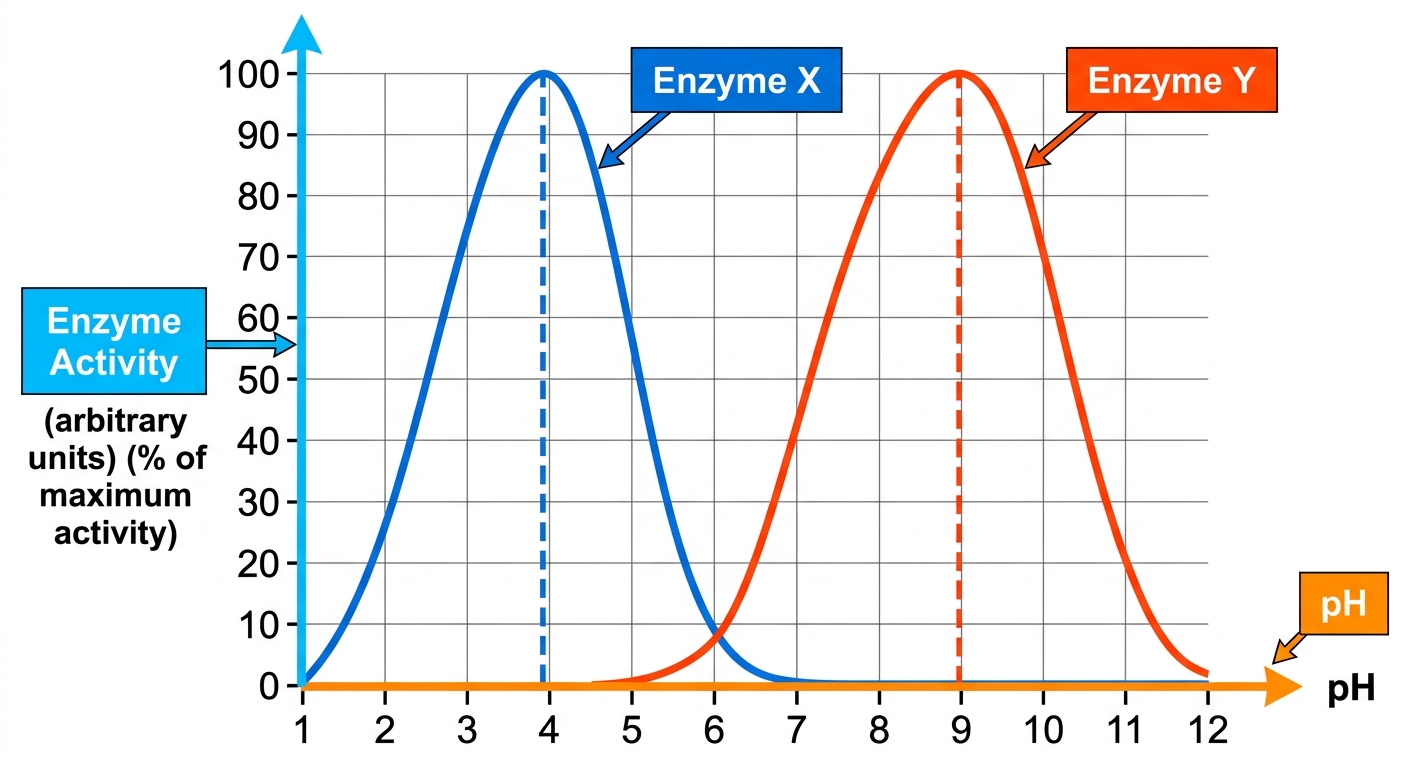
A student investigates enzyme activity across a range of pH values. The graph shows activity curves for two enzymes, X and Y, found in different regions of the human digestive system.
a
Deduce the pH at which enzyme Y shows maximum activity. [1]
b
Explain how the activity of enzyme X changes as pH increases from 2 to 7, referring to enzyme structure. [2]
c
Evaluate which enzyme is more likely to function in the stomach, using data from the graph to justify your answer. [1]
Solutions
5QuestionDenaturation and pH/Temperature EffectsAssessment Practice
5 marks~8 minCriterion C
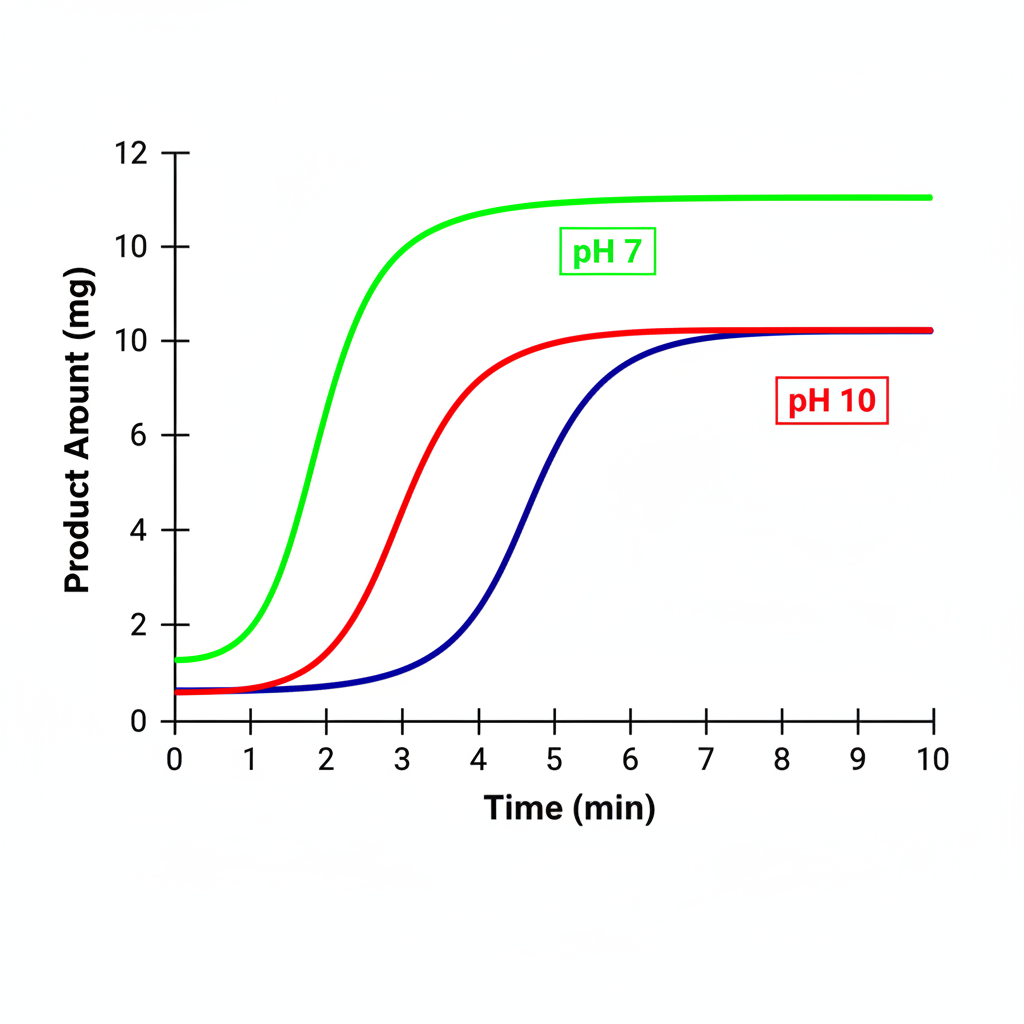
An enzyme was tested at pH 2, pH 7, and pH 10. The graph shows product formed (mg) over time (min).
At pH 7, product formation rises steeply, reaching a plateau of 10 mg at 5 min. At pH 10, product rises to 2 mg by 2 min, then remains constant. At pH 2, no product forms throughout.
A student proposes the hypothesis: "Enzymes lose activity only at extreme pH values, and this effect is reversible."
At pH 7, product formation rises steeply, reaching a plateau of 10 mg at 5 min. At pH 10, product rises to 2 mg by 2 min, then remains constant. At pH 2, no product forms throughout.
A student proposes the hypothesis: "Enzymes lose activity only at extreme pH values, and this effect is reversible."
a
Describe what the graph data show about enzyme activity at each pH value. [1]
b
Explain, at the molecular level, why enzyme activity is lost at pH 2 and pH 10. [2]
c
Evaluate the student's hypothesis using the graph data and your knowledge of denaturation. [2]
Solutions
That's every free question here — 5 of 122.
+117 more questions, plus Mock Papers & Worksheets, are waiting in Premium.