You're viewing free preview questions — 4 questions previewing here — subscribe to unlock 83 more, plus the Full Question Bank, Mock Papers & Worksheets.Upgrade
Greenhouse gases and global warming — Free MYP5 Chemistry Practice Questions

1QuestionGlobal warming vs climate changeConcept Practice
2 marks~3 minCriterion A
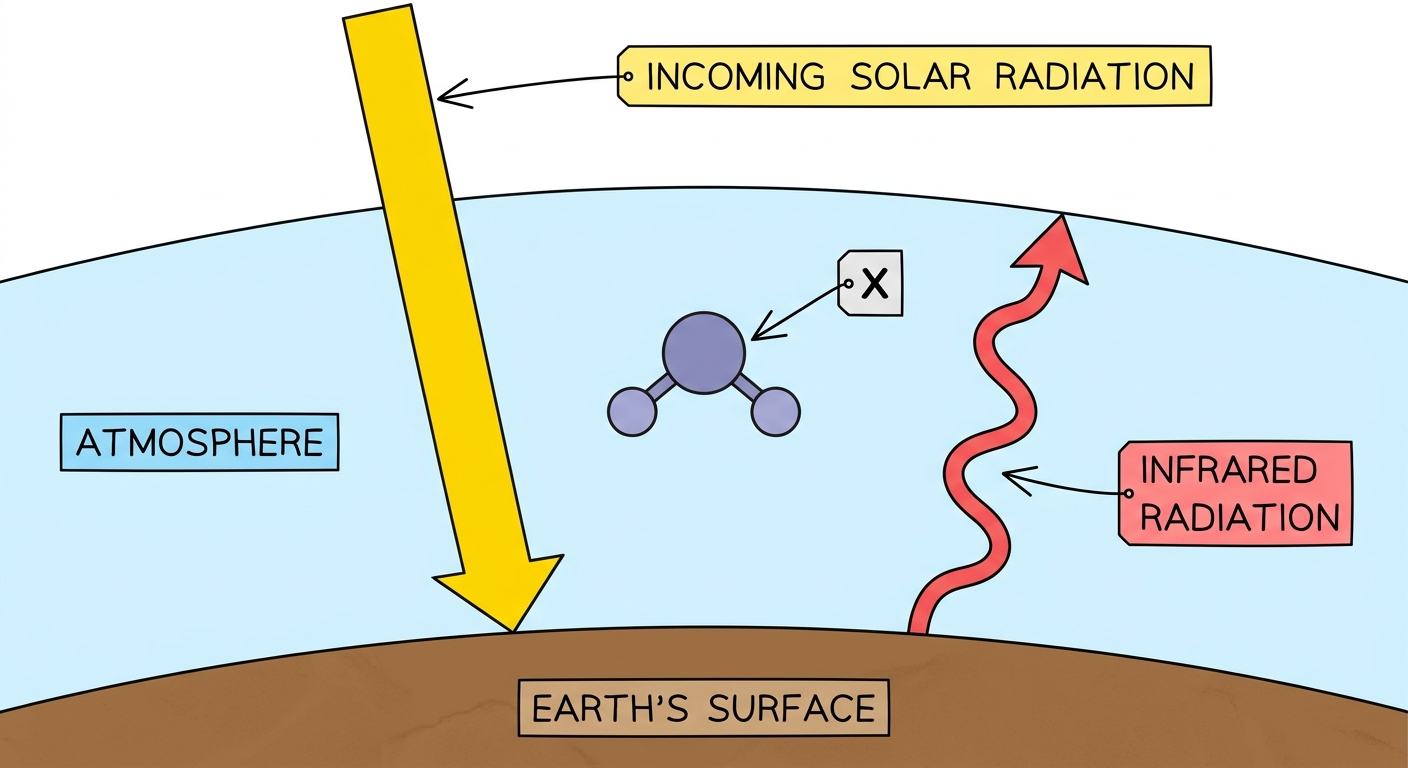
The diagram shows a simplified model of Earth's atmosphere. Incoming solar radiation passes through the atmosphere and warms Earth's surface. The surface then emits infrared radiation, some of which is absorbed by molecule X shown in the diagram.
a
Identify molecule X. [1]
b
Explain how molecule X contributes to the greenhouse effect. [1]

Solutions
2QuestionCarbon footprint and reduction strategiesAssessment Practice
2 marks~3 minCriterion D
A household consumes 5000 kWh of electricity annually. The national grid emission factor is 0.5 kg CO2 per kWh.
a
Calculate the household's annual CO2 emissions in tonnes. [1]
b
The emission factor is assumed to be constant throughout the year. Explain how this assumption could affect the accuracy of the calculated carbon footprint. [1]

Solutions
3QuestionGreenhouse effect mechanismAssessment Practice
4 marks~6 minCriterion C
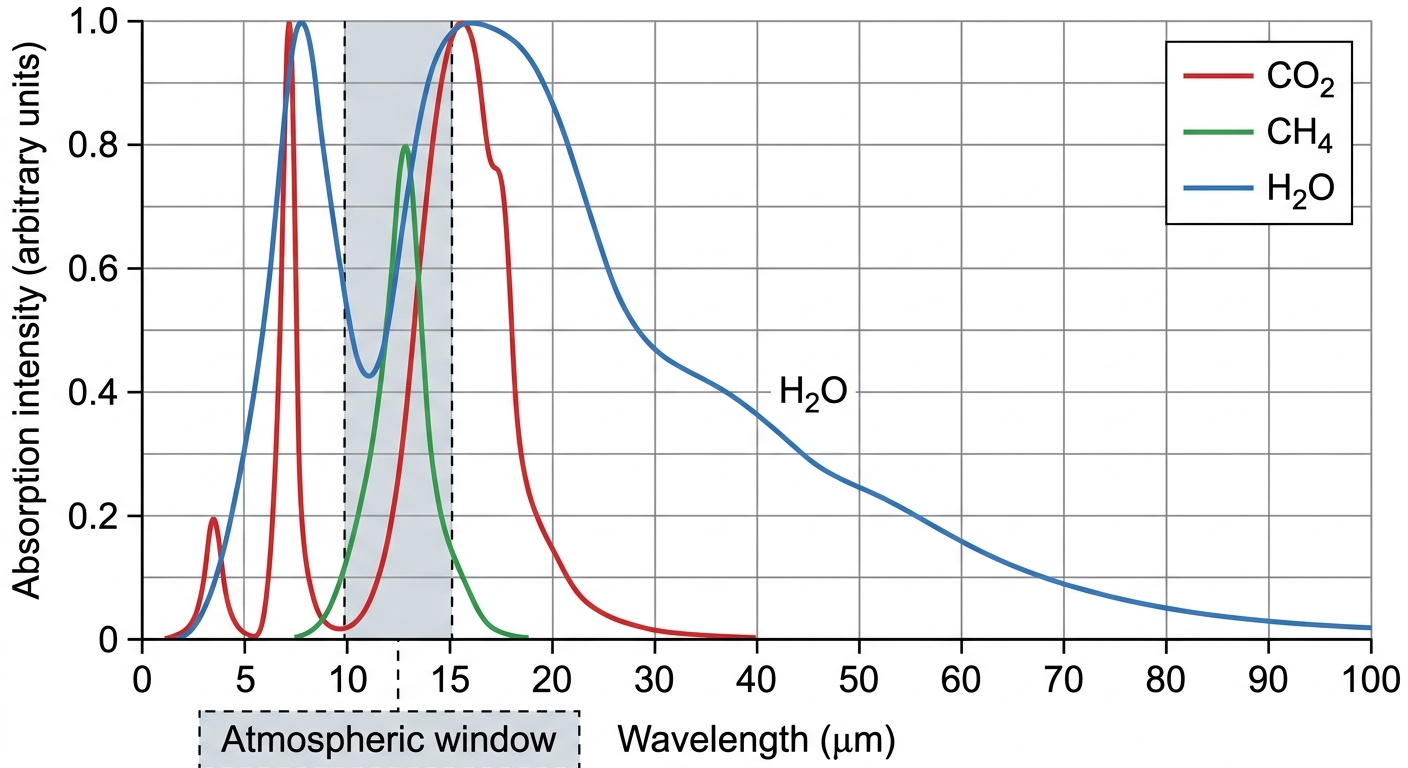
Infrared absorption data for three greenhouse gases are given below.
absorbs at: 2.0–2.8, 4.2–4.4, 13–17
absorbs at: 3.2–3.5, 7.0–8.3
absorbs at: 5.5–7.5, 12–20, 20–100
A fourth atmospheric gas, X, shows a strong absorption peak at 8–12 and a weaker peak near 4.5 . The 8–12 region is the atmospheric window, where , , and absorb very little infrared radiation.
absorbs at: 2.0–2.8, 4.2–4.4, 13–17
absorbs at: 3.2–3.5, 7.0–8.3
absorbs at: 5.5–7.5, 12–20, 20–100
A fourth atmospheric gas, X, shows a strong absorption peak at 8–12 and a weaker peak near 4.5 . The 8–12 region is the atmospheric window, where , , and absorb very little infrared radiation.
a
Deduce the identity of gas X from the following options: , , , or (). Justify your reasoning by comparing the absorption data of gas X with that of the three gases above. [2]
b
Discuss why an equal concentration of gas X in the atmosphere produces a greater enhancement of the greenhouse effect than . [2]
Solutions
4QuestionGreenhouse effect mechanismAssessment Practice
2 marks~3 minCriterion B
The table below shows atmospheric CO concentration and average global temperature recorded over four decades.
| Decade | 1970 | 1980 | 1990 | 2000 |
|---|---|---|---|---|
| CO concentration (ppm) | 325 | 338 | 354 | 369 |
| Average global temperature (°C) | 14.0 | 14.2 | 14.4 | 14.6 |
a
Deduce the relationship between CO concentration and average global temperature using data from the table. [1]
b
The CO concentration is projected to reach 400 ppm. Calculate the estimated average global temperature at this concentration, showing your reasoning clearly. [1]
Solutions
That's every free question here — 4 of 87.
+83 more questions, plus Mock Papers & Worksheets, are waiting in Premium.