You're viewing free preview questions — 4 questions previewing here — subscribe to unlock 64 more, plus the Full Question Bank, Mock Papers & Worksheets.Upgrade
Energy Profiles and Bond Theory — Free MYP5 Chemistry Practice Questions

1QuestionInterpreting energy diagrams (peaks, energy levels)Concept Practice
4 marks~6 minCriterion A
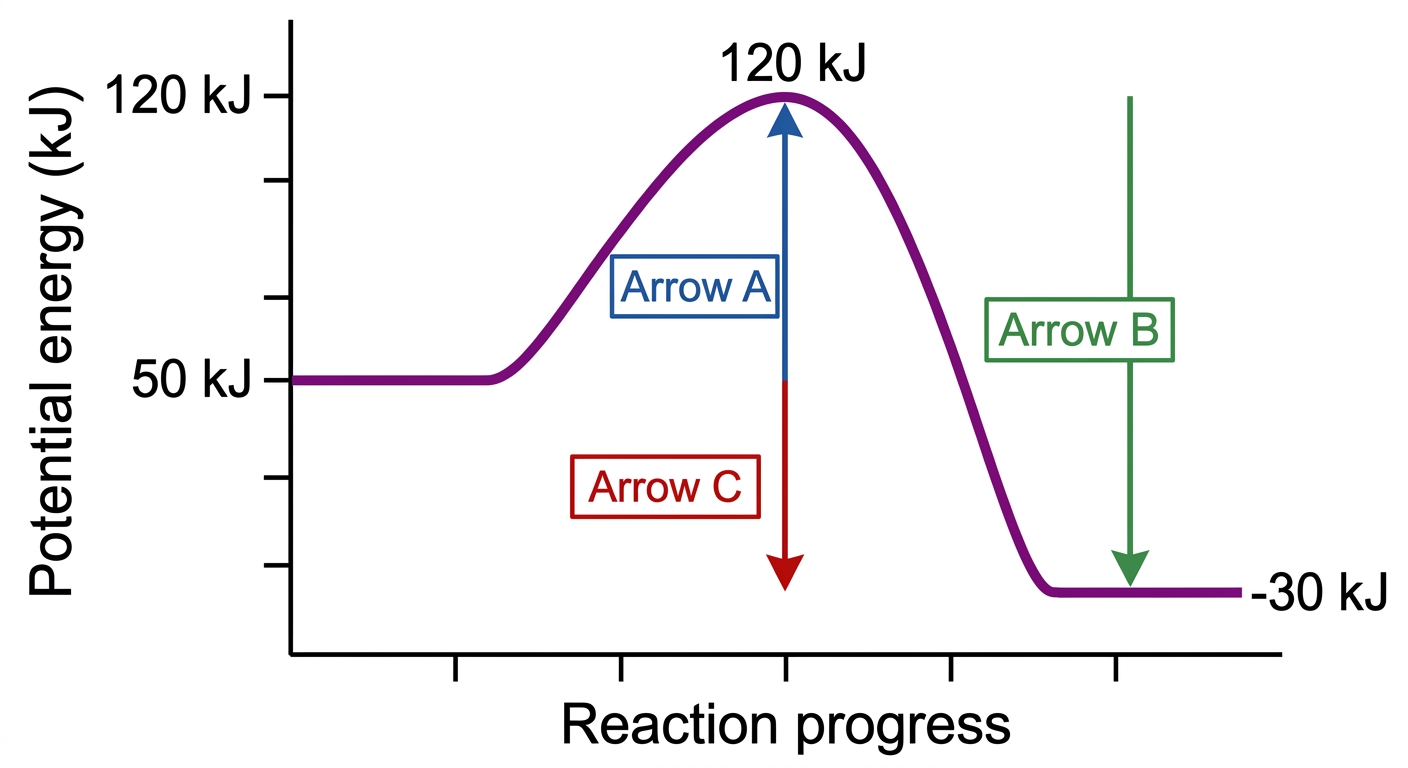
The energy profile below represents a chemical reaction.
Diagram description: Reactants at , transition state (peak) at , products at . The x-axis is labelled "Reaction progress" and the y-axis "Potential energy (kJ)". Arrow A runs from reactants to the peak; Arrow B runs from the peak to products; Arrow C runs from reactants to products.
Diagram description: Reactants at , transition state (peak) at , products at . The x-axis is labelled "Reaction progress" and the y-axis "Potential energy (kJ)". Arrow A runs from reactants to the peak; Arrow B runs from the peak to products; Arrow C runs from reactants to products.
a
Identify which arrow (A, B, or C) represents the activation energy of this reaction. [1]
b
Deduce the overall energy change of the reaction, in kJ, and state whether energy is released or absorbed. [1]
c
The products of this reaction are described as thermodynamically more stable than the reactants. Using values from the diagram, explain how the energy profile supports this claim. [2]

Solutions
2QuestionInterpreting energy diagrams (peaks, energy levels)Assessment Practice
5 marks~8 minCriterion C
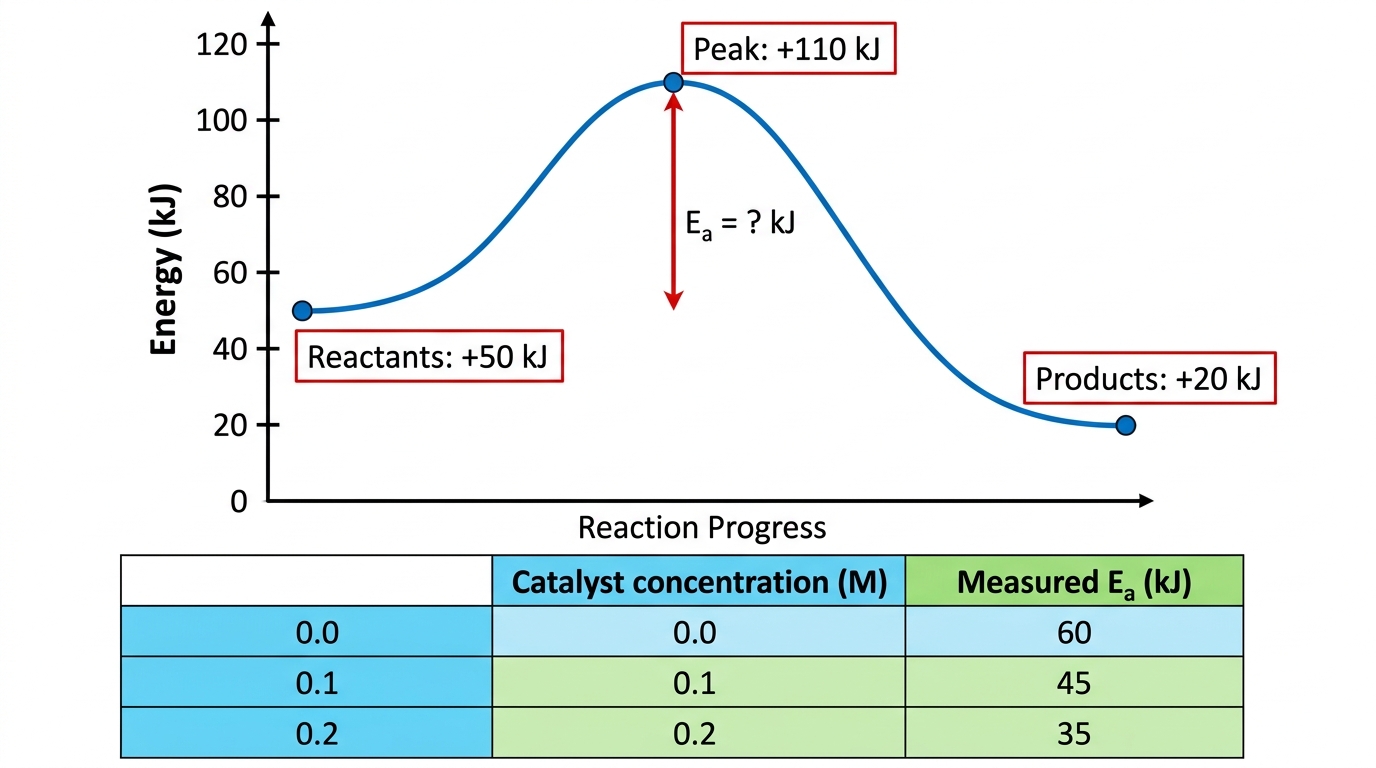
An energy diagram for a reaction shows reactant energy at , product energy at , and a peak energy at . A student proposes: "Catalyst concentration inversely correlates with activation energy."
Experimental data collected at varying catalyst concentrations:
Experimental data collected at varying catalyst concentrations:
| Catalyst concentration (M) | 0.0 | 0.1 | 0.2 |
|---|---|---|---|
| Measured (kJ) | 60 | 45 | 35 |
a
Calculate the activation energy from the energy diagram. [1]
b
Deduce what the energy diagram represents in terms of the experimental conditions, using your calculated and the data table. [2]
c
Evaluate whether the experimental data supports or refutes the student's hypothesis, justifying your answer with specific values. [2]
Solutions
3QuestionEnergy profile diagrams (reactants → products)Assessment Practice
8 marks~12 minCriterion D
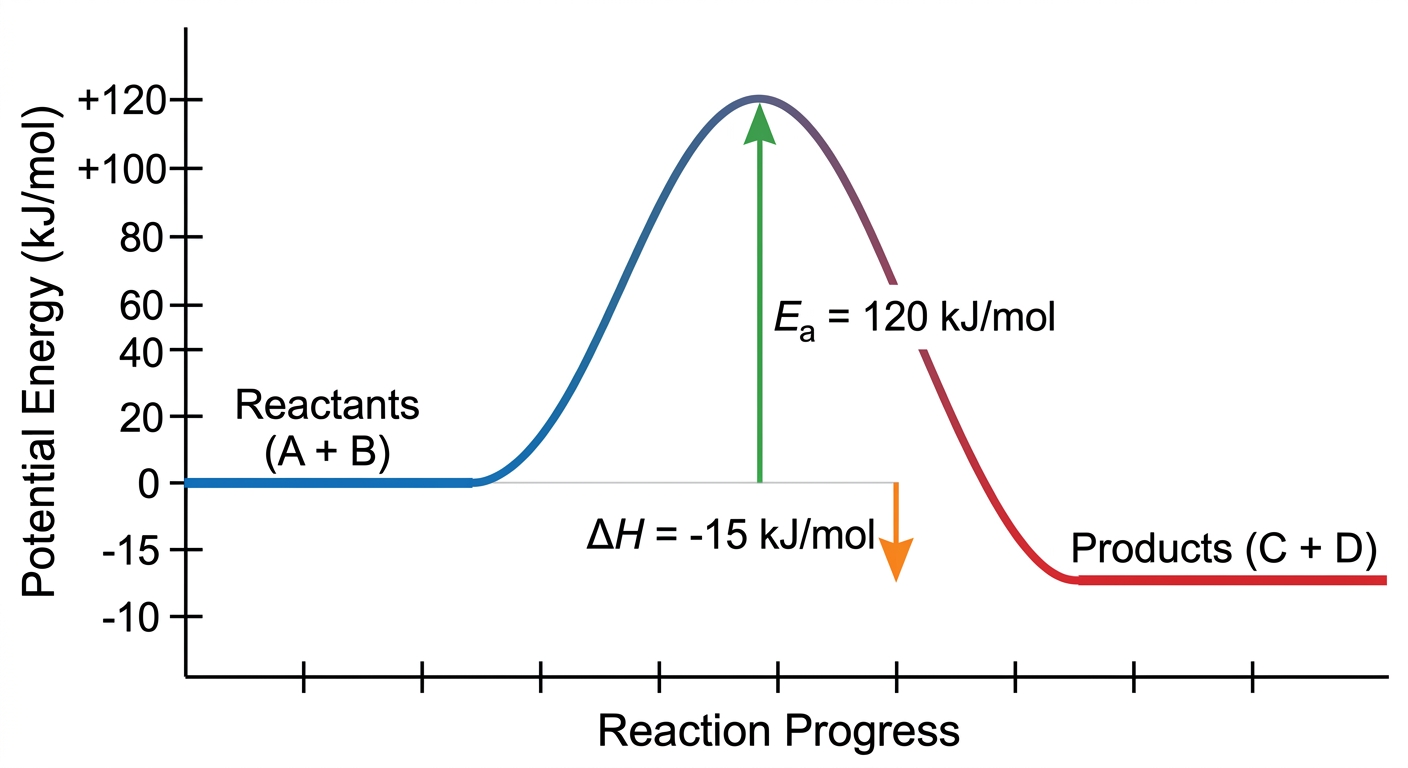
The catalytic decomposition of hydrogen peroxide, , has an enthalpy change of and an activation energy of . Without a catalyst, the reaction requires heating to approximately before products form at a measurable rate, despite the overall energy change being negative.
a
Explain the roles of and as shown on an energy profile diagram for this reaction. [2]
b
Apply collision theory to explain why heating to is necessary for the reaction to proceed at a measurable rate. [2]
c
Analyse the thermodynamic feasibility of this reaction and evaluate whether thermodynamic feasibility alone is sufficient to predict whether the reaction will occur under standard laboratory conditions. [4]
Solutions
4QuestionEnergy profile diagrams (reactants → products)Assessment Practice
3 marks~5 minCriterion B
The table below shows activation energy () and enthalpy change () for four reactions.
| Reaction | (kJ/mol) | (kJ/mol) |
|---|---|---|
| Combustion of methane | 265 | −890 |
| Decomposition of calcium carbonate | 175 | +178 |
| Neutralisation of HCl with NaOH | 10 | −57 |
| Photosynthesis | 500 | +2800 |
a
Deduce whether each reaction is endothermic or exothermic. [1]
b
Explain how the sign of determines the classification of a reaction as endothermic or exothermic. [1]
c
Analyse the relationship between and reaction type (endothermic or exothermic) using the data provided. [1]
Solutions
That's every free question here — 4 of 68.
+64 more questions, plus Mock Papers & Worksheets, are waiting in Premium.