You're viewing free preview questions — 4 questions previewing here — subscribe to unlock 82 more, plus the Full Question Bank, Mock Papers & Worksheets.Upgrade
Graphs of Functions — Free MYP5 Mathematics (Extended) Practice Questions

1QuestionPlot linear functionsConcept Practice
4 marks~6 minCriterion A
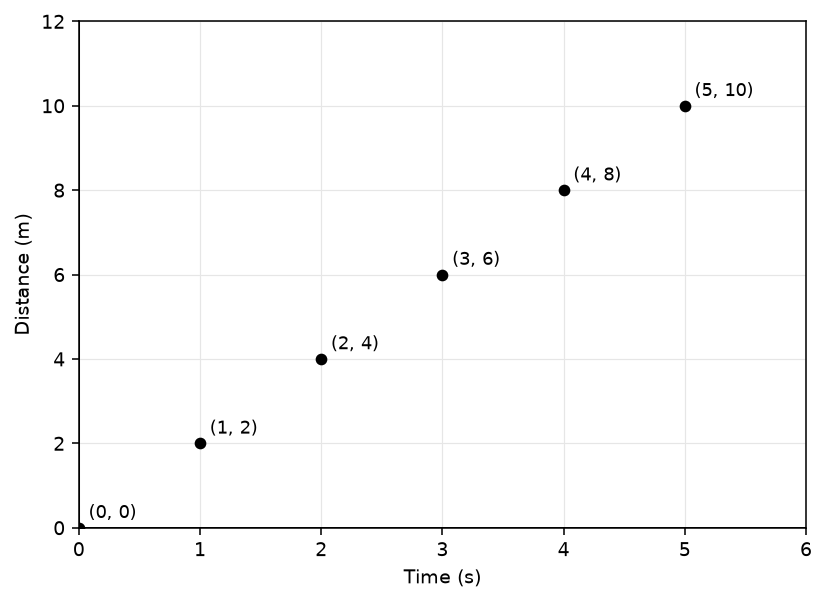
A student tests a remote-controlled car on a straight track, recording the following data.
| Time (s) | 0 | 1 | 2 | 3 | 4 | 5 |
|---|---|---|---|---|---|---|
| Distance (m) | 0 | 2 | 4 | 6 | 8 | 10 |
a
Construct a graph of distance against time, plotting all six points on a fully labelled coordinate grid. Describe the pattern shown by the points. [2]
b
Deduce the equation that models the relationship between distance (m) and time (s), showing your reasoning. [1]
c
The track available for testing is 13 m long. Advise the student whether it is safe to run the car for 7 seconds without reaching the end of the track. Justify your answer with a calculation. [1]

Solutions
2QuestionPlot quadratic functionsAssessment Practice
4 marks~6 minCriterion D
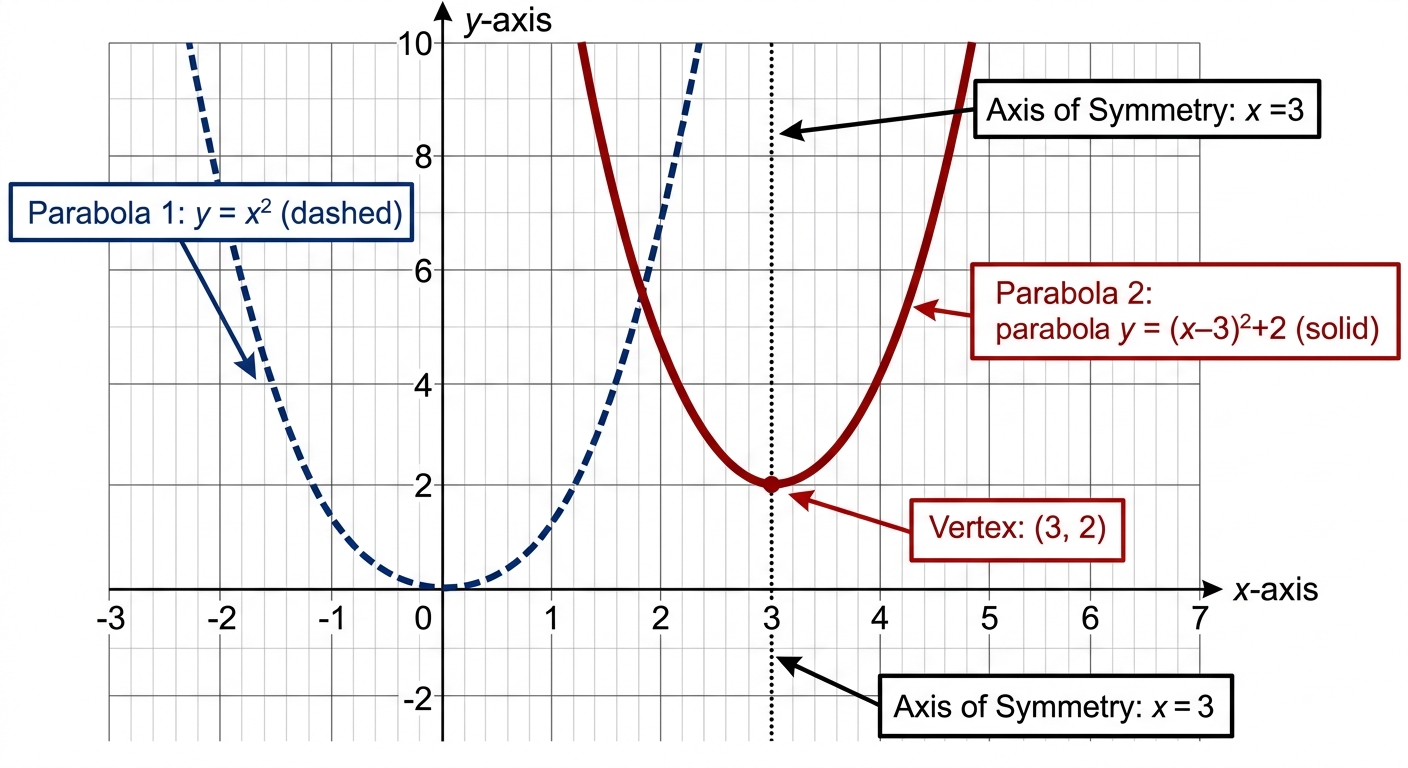
A landscape architect models the cross-section of a decorative arch using the function , where and are measured in metres. The parent function is .
a
State the coordinates of the vertex of and write down the equation of its axis of symmetry. [2]
b
Explain the two transformations that map the graph of onto the graph of . [1]
c
The arch must clear a pathway centred at that is 4 metres wide and 2.5 metres tall. Advise the architect whether the arch satisfies both clearance requirements, supporting your advice with calculations. [1]
Solutions
3QuestionPlot linear functionsAssessment Practice
6 marks~9 minCriterion C
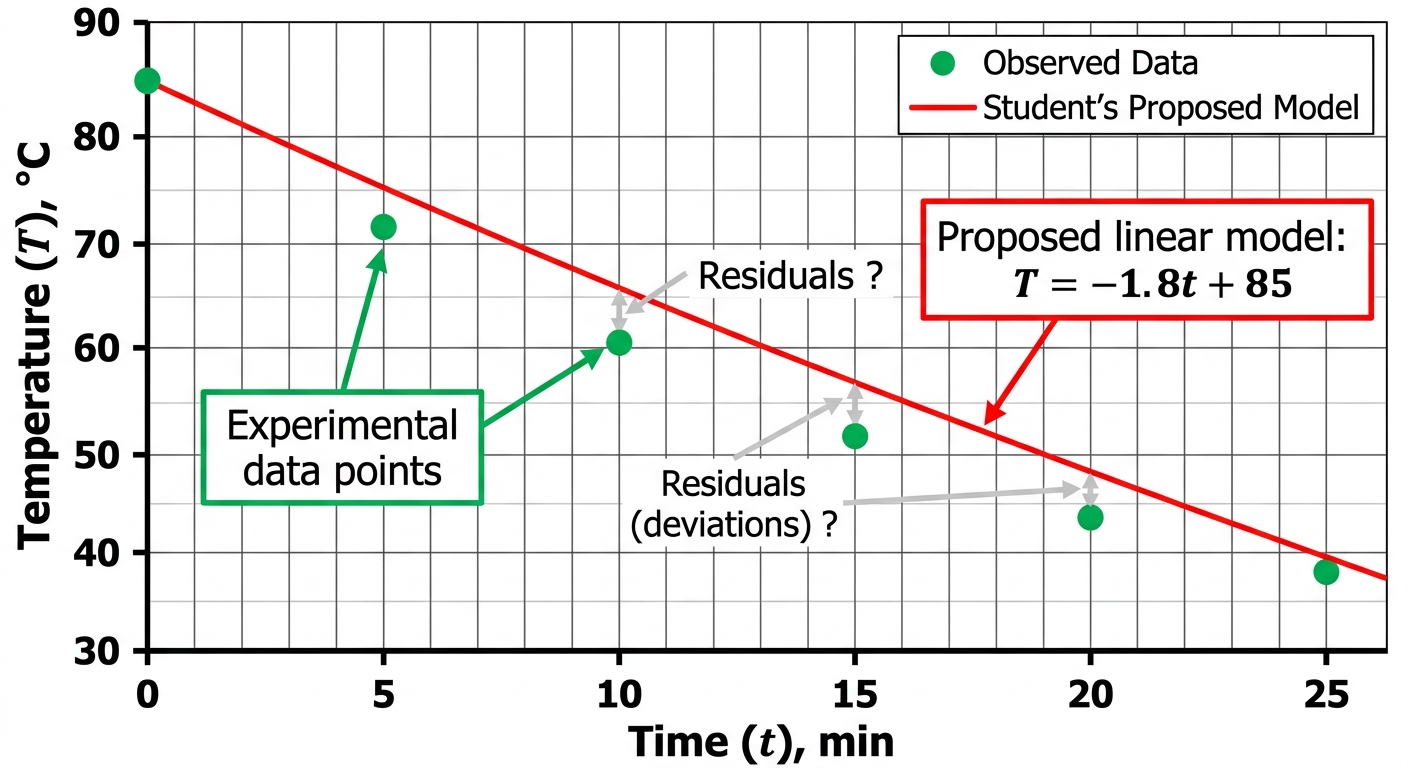
A student investigates the cooling of a hot liquid by recording its temperature (, in °C) every 5 minutes (, in minutes):
(min): 0, 5, 10, 15, 20, 25
(°C): 85, 72, 61, 52, 44, 38
The student proposes the linear model to describe the cooling.
(min): 0, 5, 10, 15, 20, 25
(°C): 85, 72, 61, 52, 44, 38
The student proposes the linear model to describe the cooling.
a
Calculate the predicted temperature at each time value using the model . Show all working. [2]
b
Deduce the residual (actual minus predicted) for each data point and describe the pattern you observe. [2]
c
Critique the student's decision to use the linear model for this cooling process, with reference to the residuals from part (b) and the real-world behaviour of cooling liquids. [2]
Solutions
4QuestionPlot quadratic functionsAssessment Practice
6 marks~9 minCriterion B
A structural engineer models the vertical cross-section of a concrete arch using the quadratic function , where is the height (in metres) at horizontal position (in metres). Measurements taken at five positions are recorded below.
(m):
(m):
(m):
(m):
a
Calculate the first differences and second differences of the -values. [2]
b
Deduce the value of , given that the second difference of a quadratic with unit steps equals . Hence state the equation of the arch. [1]
c
The arch must clear a minimum height of m at m to allow vehicles to pass beneath it. Substituting into your equation from part (b), advise the engineer whether the arch is safe for vehicles at that position. [3]
Solutions
That's every free question here — 4 of 86.
+82 more questions, plus Mock Papers & Worksheets, are waiting in Premium.