You're viewing free preview questions — 4 questions previewing here — subscribe to unlock 137 more, plus the Full Question Bank, Mock Papers & Worksheets.Upgrade
Types of Functions — Free MYP5 Mathematics (Extended) Practice Questions

1QuestionQuadratic functionsConcept Practice
4 marks~6 minCriterion A
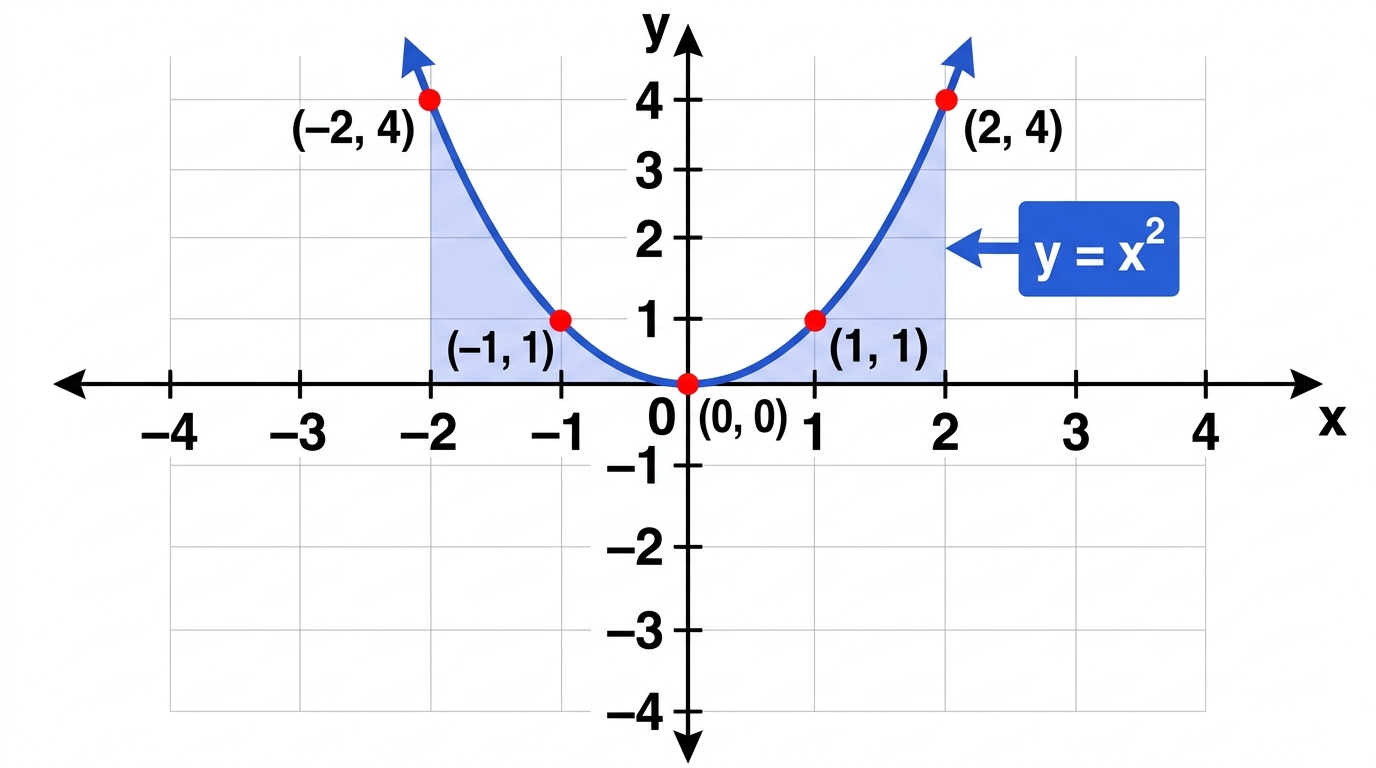
A landscape architect models the cross-section of a decorative arch using the function . The design is adjusted for a new location, giving the function , where and are measured in metres.
a
Describe the transformations applied to the graph of to obtain the graph of . [2]
b
Deduce the coordinates of the vertex and the equation of the axis of symmetry of . [1]
c
The arch must have its lowest point at least 1.5 m above ground level and no more than 4 m horizontally from . Justify whether the adjusted design satisfies both conditions. [1]

Solutions
2QuestionIdentify from graphsAssessment Practice
2 marks~3 minCriterion C
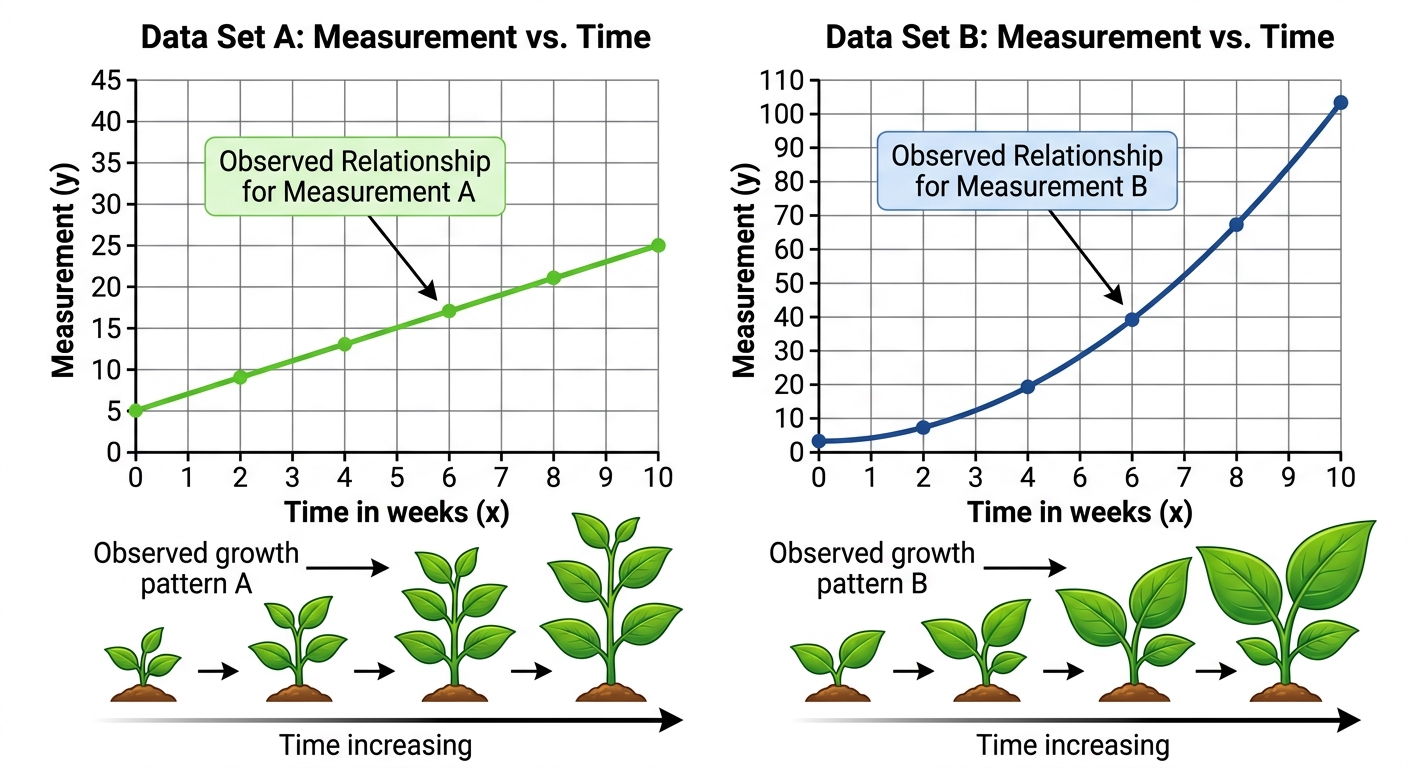
A biologist records two measurements of a growing plant over weeks:
- Plant height (cm), modelled by
- Leaf area (cm²), modelled by
- Plant height (cm), modelled by
- Leaf area (cm²), modelled by
a
Identify which equation models plant height and which models leaf area, giving a reason for each. [1]
b
A classmate claims both measurements could equally well be modelled by a linear function for the first four weeks. Justify whether this claim is valid, and explain what this means for the biologist's conclusions about long-term growth. [1]
Solutions
3QuestionIdentify from graphsAssessment Practice
4 marks~6 minCriterion B
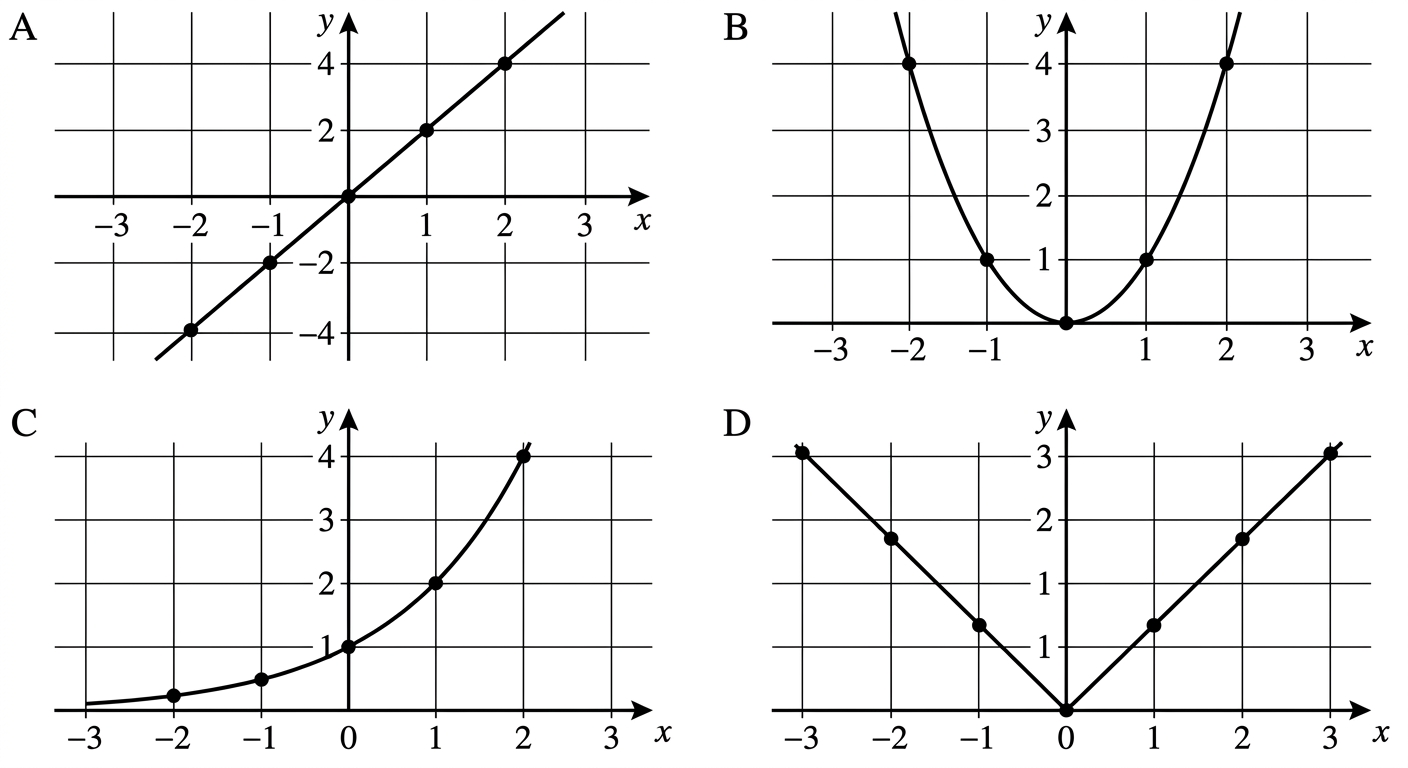
A scientist records the spread of a ground-cover plant (in cm²) over four consecutive weeks. Four candidate models are proposed; their graphs are labelled A–D.
Graph A:
Graph B:
Graph C:
Graph D:
Graph A:
Graph B:
Graph C:
Graph D:
a
Calculate the first differences for each graph. [1]
b
Deduce which graph models linear growth and which models quadratic growth. Justify your answer using first and second differences. [2]
c
The scientist needs a model predicting accelerating, unbounded growth with no reflective symmetry about the vertical axis. Recommend which of the four graphs best fits this requirement, and justify your choice using the pattern of its differences. [1]
Solutions
4QuestionRational functionsAssessment Practice
5 marks~8 minCriterion D
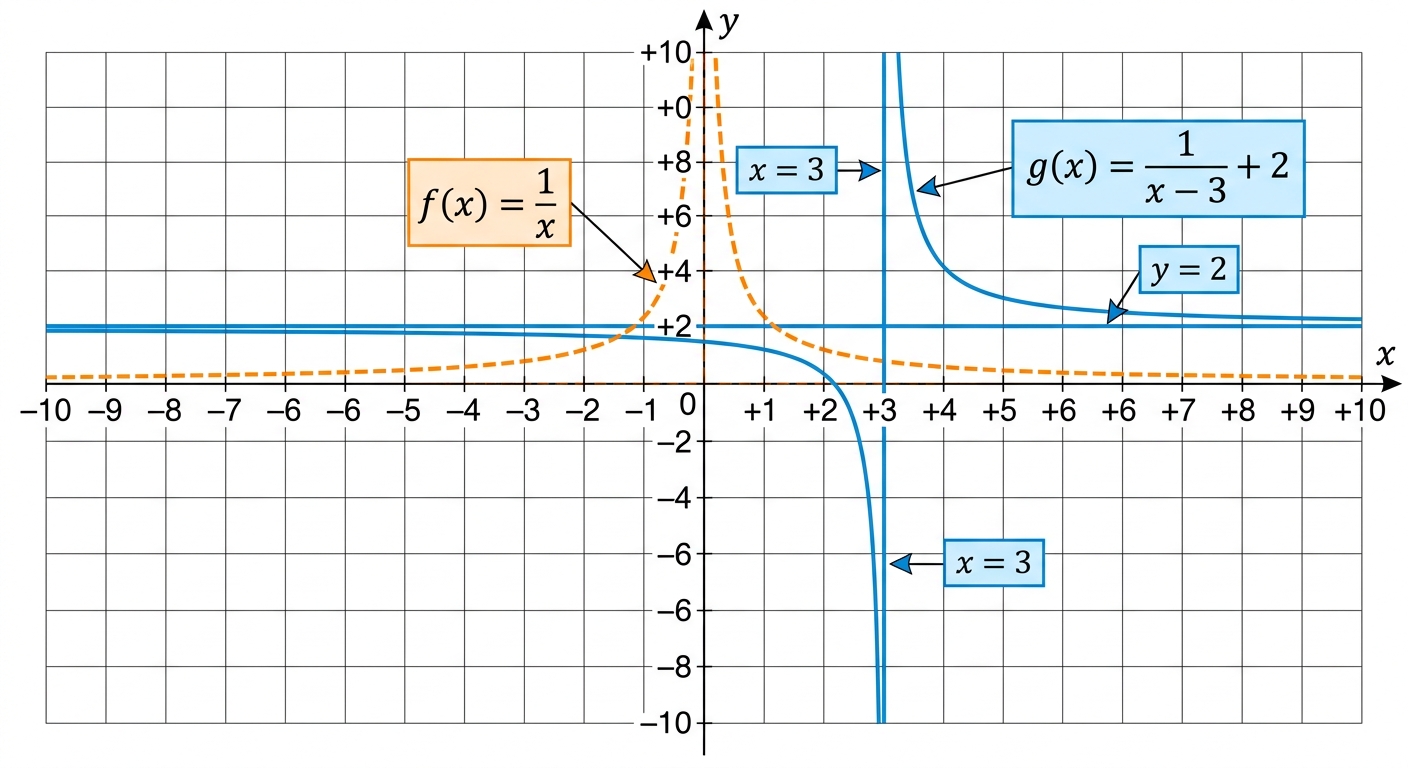
A hospital monitoring system tracks a patient's drug concentration using the model , where is time in hours after administration () and is concentration in mg/L. The parent function is .
a
State the equations of the vertical and horizontal asymptotes of . [1]
b
Explain how each transformation applied to shifts the asymptotes to produce those of , stating the equation of each asymptote of . [2]
c
The system triggers a safety alert when concentration remains above 2 mg/L. Using the horizontal asymptote of , advise whether the safety alert will ever automatically clear for . Justify your answer. [2]
Solutions
That's every free question here — 4 of 141.
+137 more questions, plus Mock Papers & Worksheets, are waiting in Premium.