You're viewing free preview questions — 4 questions previewing here — subscribe to unlock 58 more, plus the Full Question Bank, Mock Papers & Worksheets.Upgrade
Graphing Linear Equations — Free MYP5 Mathematics (Extended) Practice Questions

1QuestionInterpreting and Writing Linear Equations from GraphConcept Practice
2 marks~3 minCriterion A
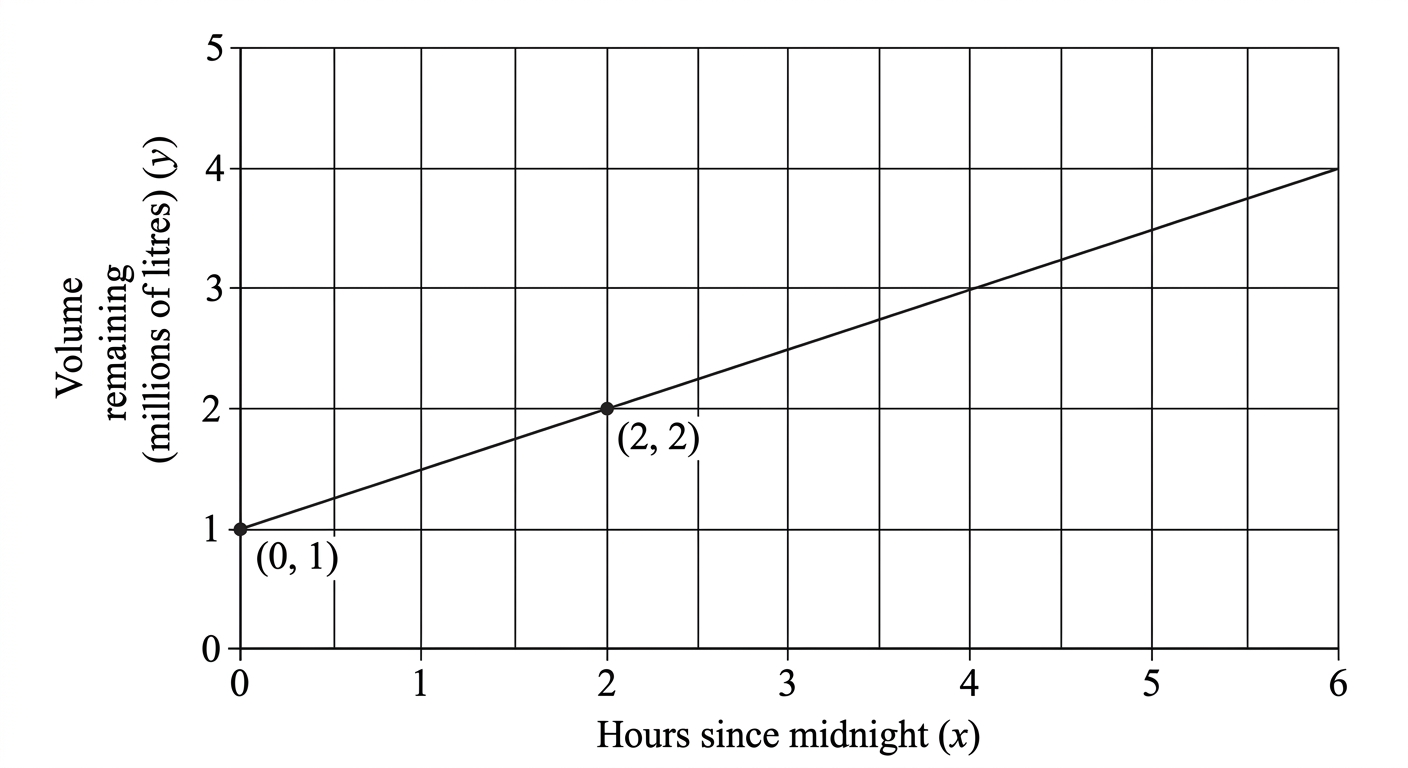
A city's water authority monitors daily water usage. A graph shows a linear relationship between the number of hours since midnight, , and the volume of water (in millions of litres) remaining in a reservoir, . The line passes through and .
State the slope and -intercept of the line, and write the equation of the line in the form . [1]
Interpret what the slope and -intercept each represent in this context. [1]
State the slope and -intercept of the line, and write the equation of the line in the form . [1]
Interpret what the slope and -intercept each represent in this context. [1]

Solutions
2QuestionDrawing Graphs from y = mx + cAssessment Practice
4 marks~6 minCriterion D
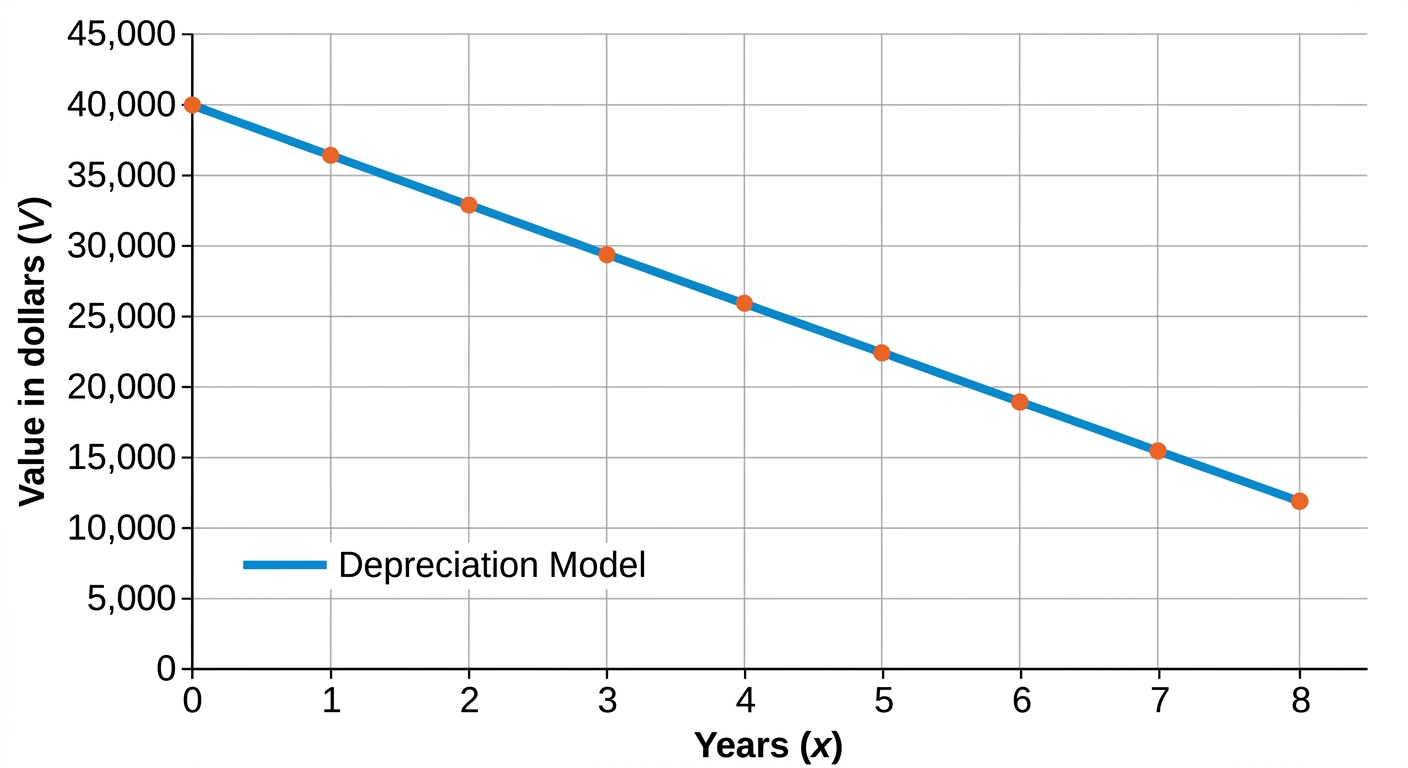
A company purchases a delivery van for 40 000 dollars. The van loses 3 500 dollars in value each year. The value of the van after years is modelled by:
a
Calculate the value of the van after 4 years. [1]
b
Construct a graph of against for . Label both axes with their quantities and units, and indicate a clear scale. [2]
c
The company plans to sell the van once its value falls below 15 000 dollars. Using your graph or the equation, deduce the earliest year in which the van should be sold, then advise the company whether the linear model is a reliable basis for this decision. [1]
Solutions
3QuestionTable of Values and Line PlottingAssessment Practice
5 marks~8 minCriterion C
Data
(weeks):(km completed):
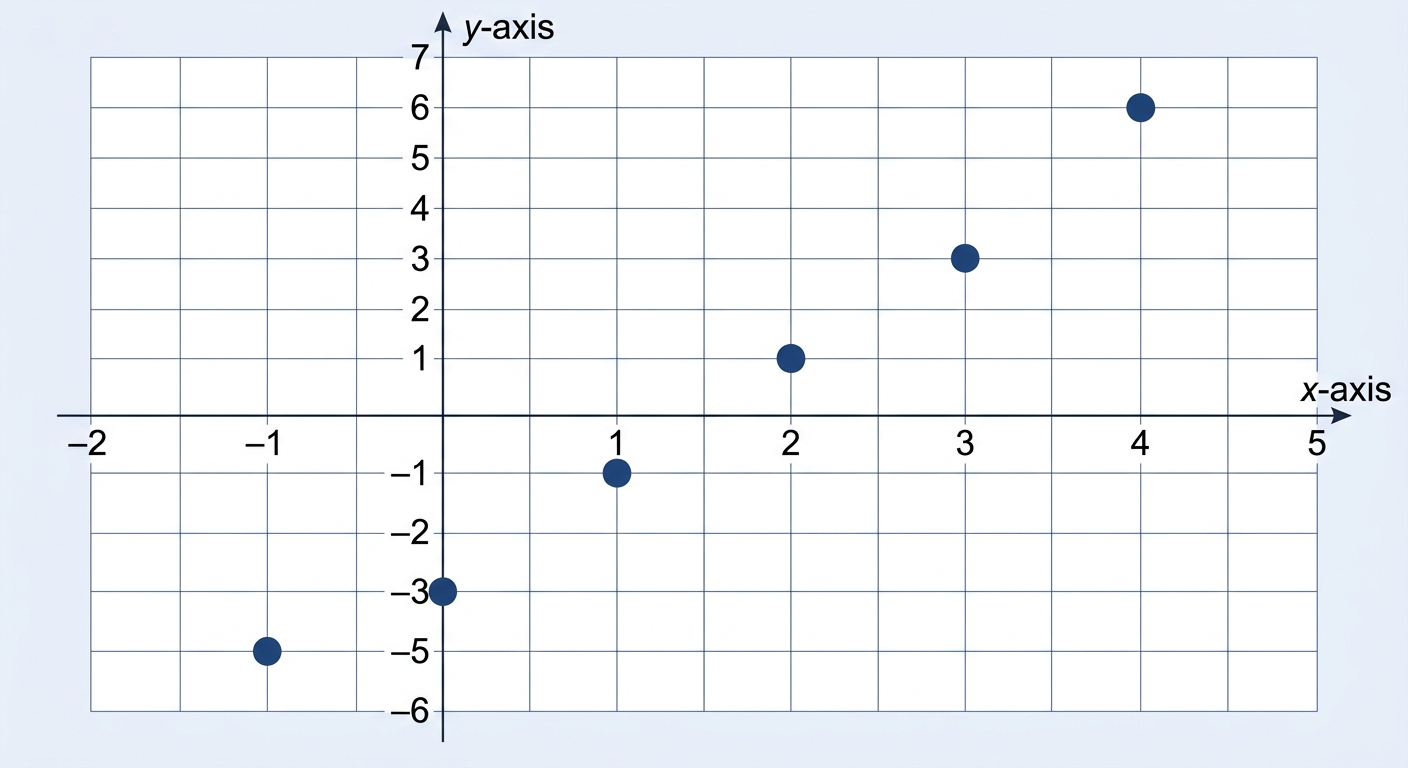
A city planner models the relationship between the number of weeks since a road project began, , and the total kilometres of road completed, , using the equation .
A technician records the following
A technician records the following
a
Plot all six coordinate pairs on a clearly labelled coordinate grid. [1]
b
Justify which coordinate pair does not lie on the line by substituting each -value into the equation and comparing the calculated -values with the recorded values. Show all working. [2]
c
Advise the city planner whether the recorded data at week 4 should be used for scheduling decisions, giving a mathematical reason for your recommendation. [2]
Solutions
4QuestionIdentifying Slope and Y-Intercept AI Generate Add Questions SummaryAssessment Practice
6 marks~9 minCriterion B
A city planner models road gradients using equations of the form , where is horizontal distance and is elevation. Four road segments are recorded:
Segment 1: , giving
Segment 2: , giving
Segment 3: , giving
Segment 4: , giving
Segment 1: , giving
Segment 2: , giving
Segment 3: , giving
Segment 4: , giving
a
Analyse the four segments to describe the relationship between the coefficients , , and the slope and -intercept in . [2]
b
Deduce a general rule expressing and in terms of , , and . [1]
c
A proposed road follows . Apply your rule to determine the slope and -intercept, then verify by converting the equation to the form . [2]
d
A second road follows . The planner states that any road with a slope steeper than is unsafe for heavy vehicles. Advise the planner whether this road should be approved for heavy-vehicle use, justifying your answer with a numerical comparison. [1]
Solutions
That's every free question here — 4 of 62.
+58 more questions, plus Mock Papers & Worksheets, are waiting in Premium.