You're viewing free preview questions — 4 questions previewing here — subscribe to unlock 34 more, plus the Full Question Bank, Mock Papers & Worksheets.Upgrade
Interpreting Real-Life Graphs — Free MYP5 Mathematics (Extended) Practice Questions

1QuestionConnecting Graphs to Real SituationsConcept Practice
2 marks~3 minCriterion A
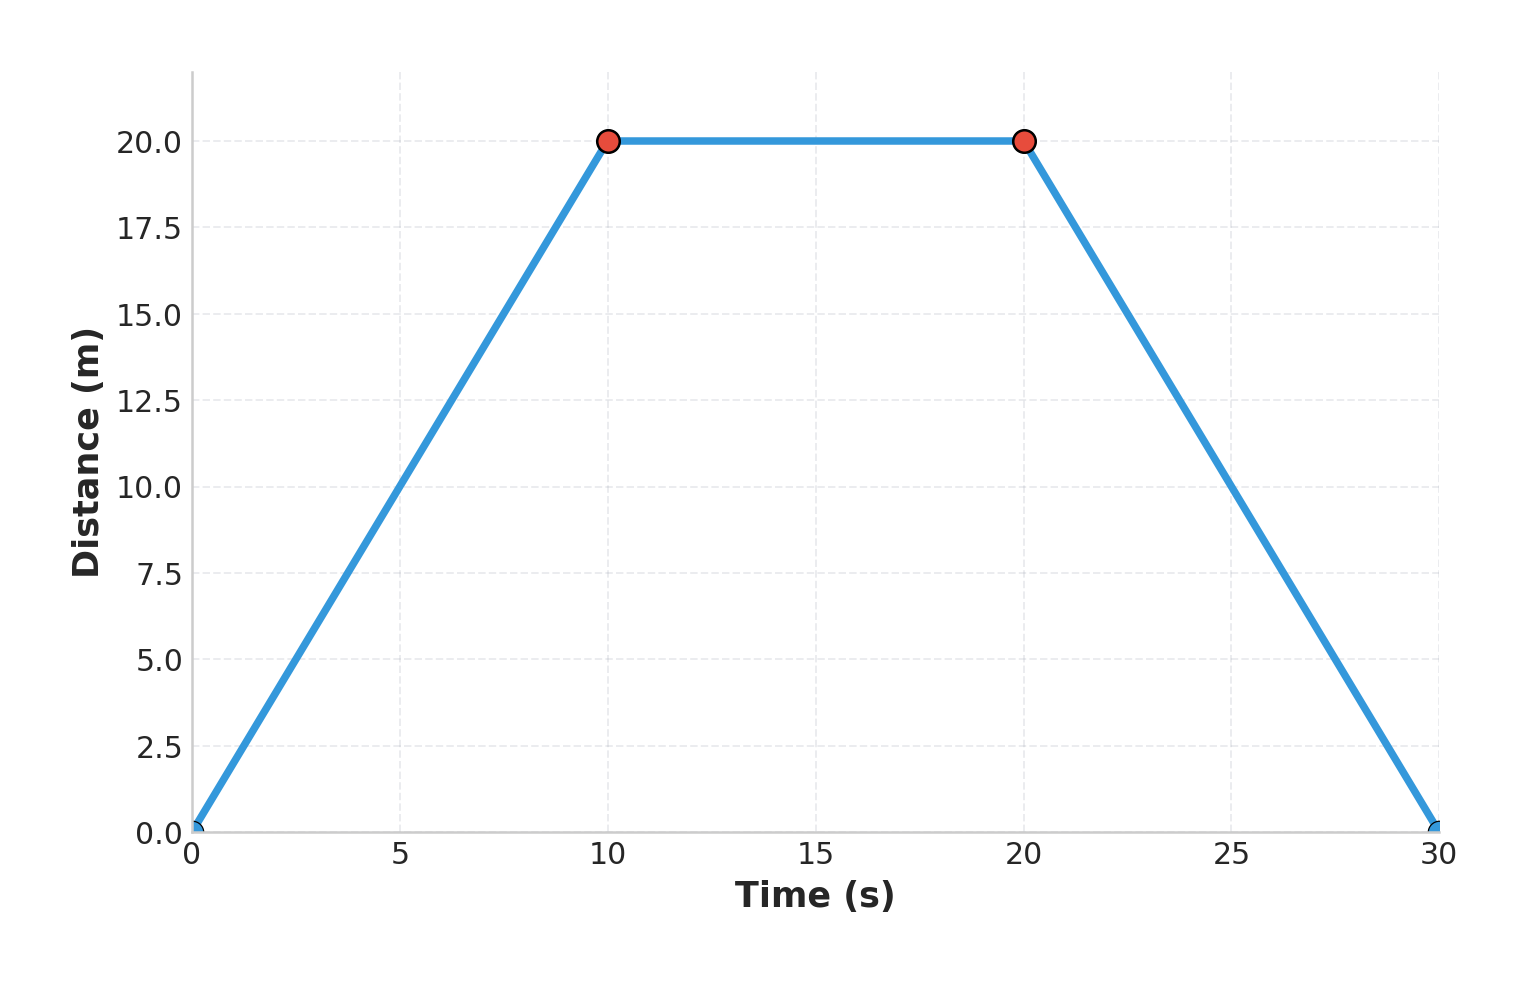
A cyclist's journey is shown on the distance–time graph.
Segment A: to s, distance increases from m to m.
Segment B: s to s, distance remains constant at m.
Segment C: s to s, distance decreases from m to m.
Segment A: to s, distance increases from m to m.
Segment B: s to s, distance remains constant at m.
Segment C: s to s, distance decreases from m to m.
a
Calculate the gradient of Segment A. [1]
b
Interpret what the gradient of Segment B tells you about the cyclist's motion during that interval. [1]

Solutions
2QuestionConnecting Graphs to Real SituationsAssessment Practice
6 marks~9 minCriterion C
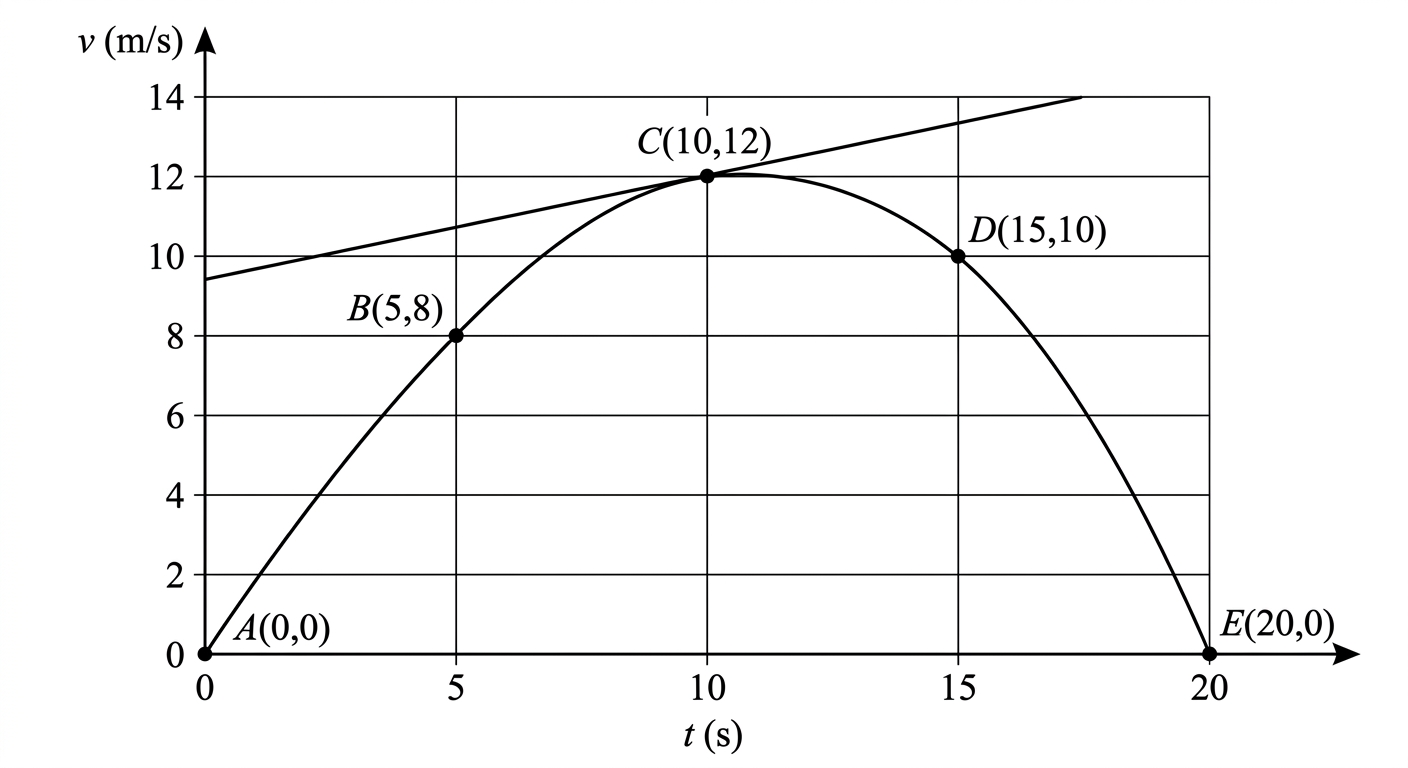
A cyclist's speed (m/s) during a 20-second ride is modelled by
and passes through , , , , and .
The derivative is .
and passes through , , , , and .
The derivative is .
a
Calculate the average rate of change of speed between s and s. [2]
b
By drawing a tangent to the curve at , estimate the instantaneous rate of change of speed at s. State the coordinates of the two points used on your tangent line. [2]
c
Calculate and advise the cyclist's coach whether the rider should increase effort, maintain pace, or begin conserving energy at s. Justify your advice using the value obtained and the shape of the graph. [2]
Solutions
3QuestionConnecting Graphs to Real SituationsConcept Practice
4 marks~6 minCriterion A
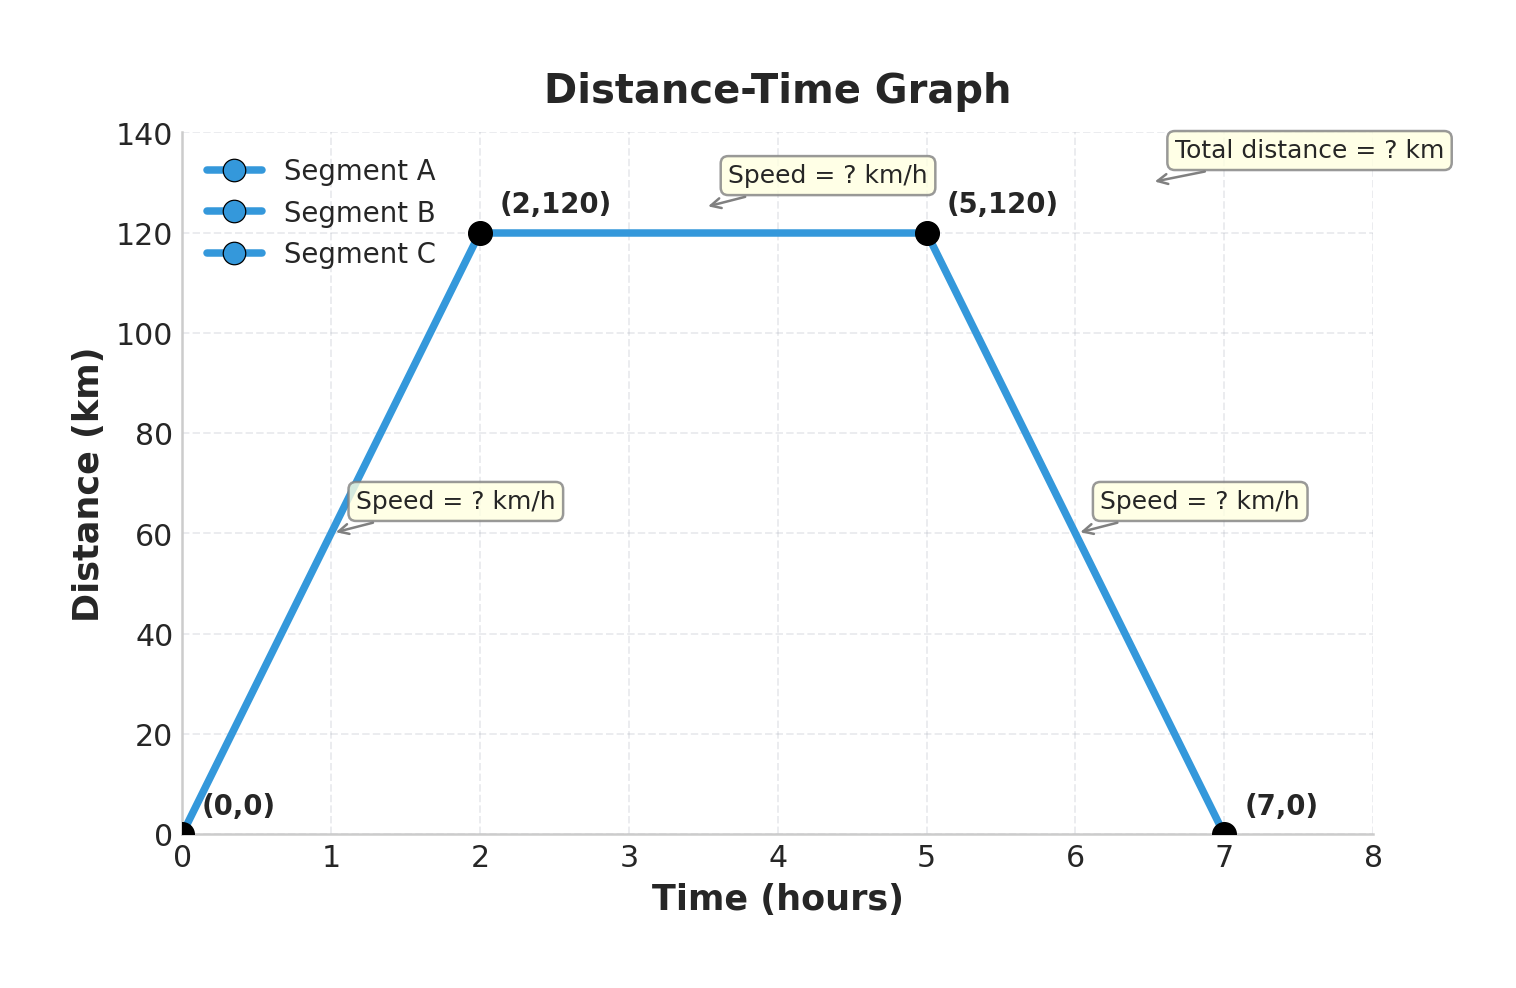
A car journey is shown on the distance–time graph.
- Segment A: to
- Segment B: to
- Segment C: to
Time is in hours; distance is in kilometres.
- Segment A: to
- Segment B: to
- Segment C: to
Time is in hours; distance is in kilometres.
a
Calculate the speed of the car during Segment A. [1]
b
Calculate the total distance travelled during the entire journey. [1]
c
The legal speed limit on this road is 55 km/h. Advise the driver whether they broke the speed limit at any point during the journey, justifying your answer with the speeds from all three segments. [2]
Solutions
4QuestionConnecting Graphs to Real SituationsAssessment Practice
6 marks~9 minCriterion D
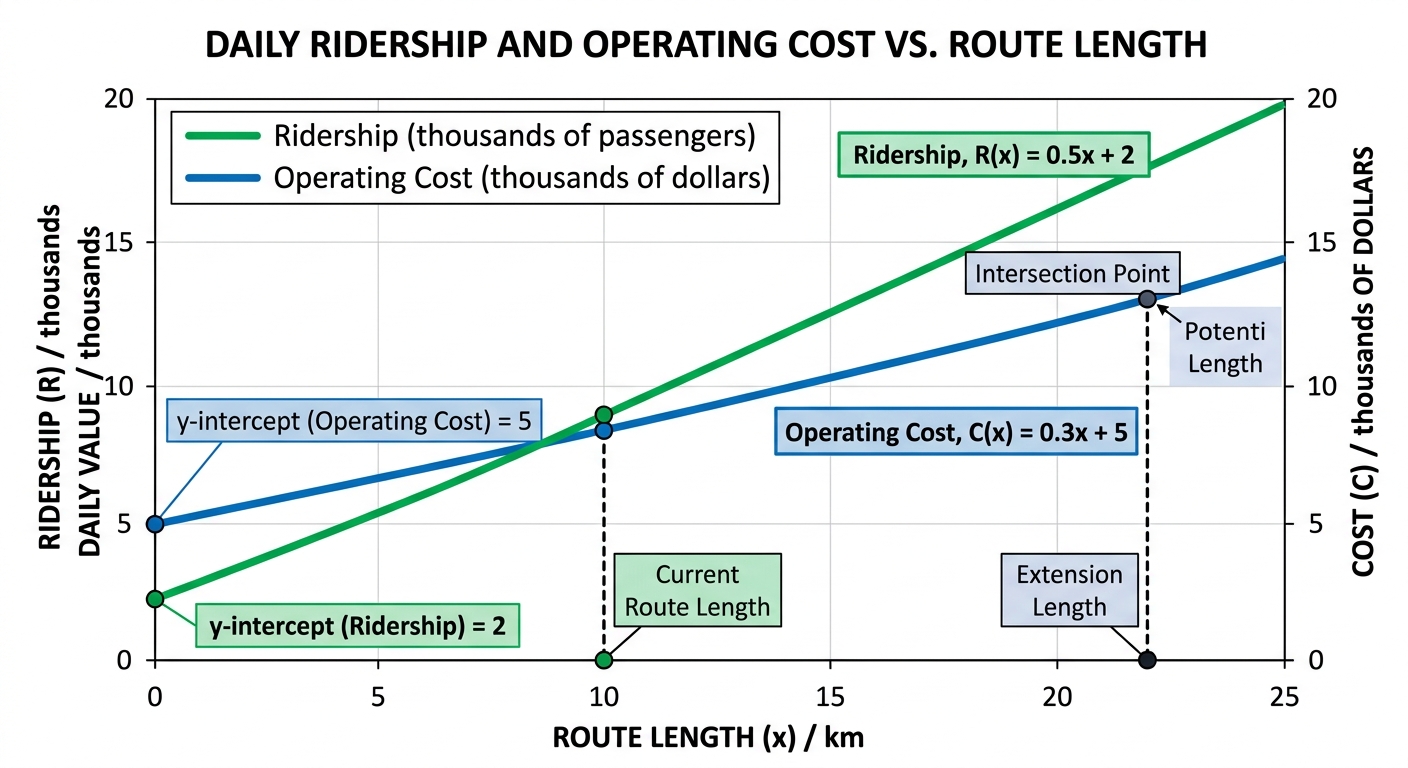
A city is considering extending a bus route. The projected daily ridership (in thousands of passengers) as a function of route length km is
and the daily operating cost (in thousands of dollars) is
Each passenger pays a fare of 2.50 dollars. The current route length is 10 km, and the city plans to extend the route to 22 km.
and the daily operating cost (in thousands of dollars) is
Each passenger pays a fare of 2.50 dollars. The current route length is 10 km, and the city plans to extend the route to 22 km.
a
Calculate the current daily profit, where profit = revenue operating cost and revenue = fare ridership. [2]
b
Determine the route length at which daily revenue equals daily operating cost. [2]
c
Advise the city whether the planned extension to 22 km is financially justified. In your response, identify one limitation of the linear model and explain how it could affect the reliability of your advice. [2]
Solutions
That's every free question here — 4 of 38.
+34 more questions, plus Mock Papers & Worksheets, are waiting in Premium.