You're viewing free preview questions — 4 questions previewing here — subscribe to unlock 143 more, plus the Full Question Bank, Mock Papers & Worksheets.Upgrade
Graphs of Logarithmic Functions — Free MYP5 Mathematics (Extended) Practice Questions

1QuestionBasic log function graphsConcept Practice
2 marks~3 minCriterion A
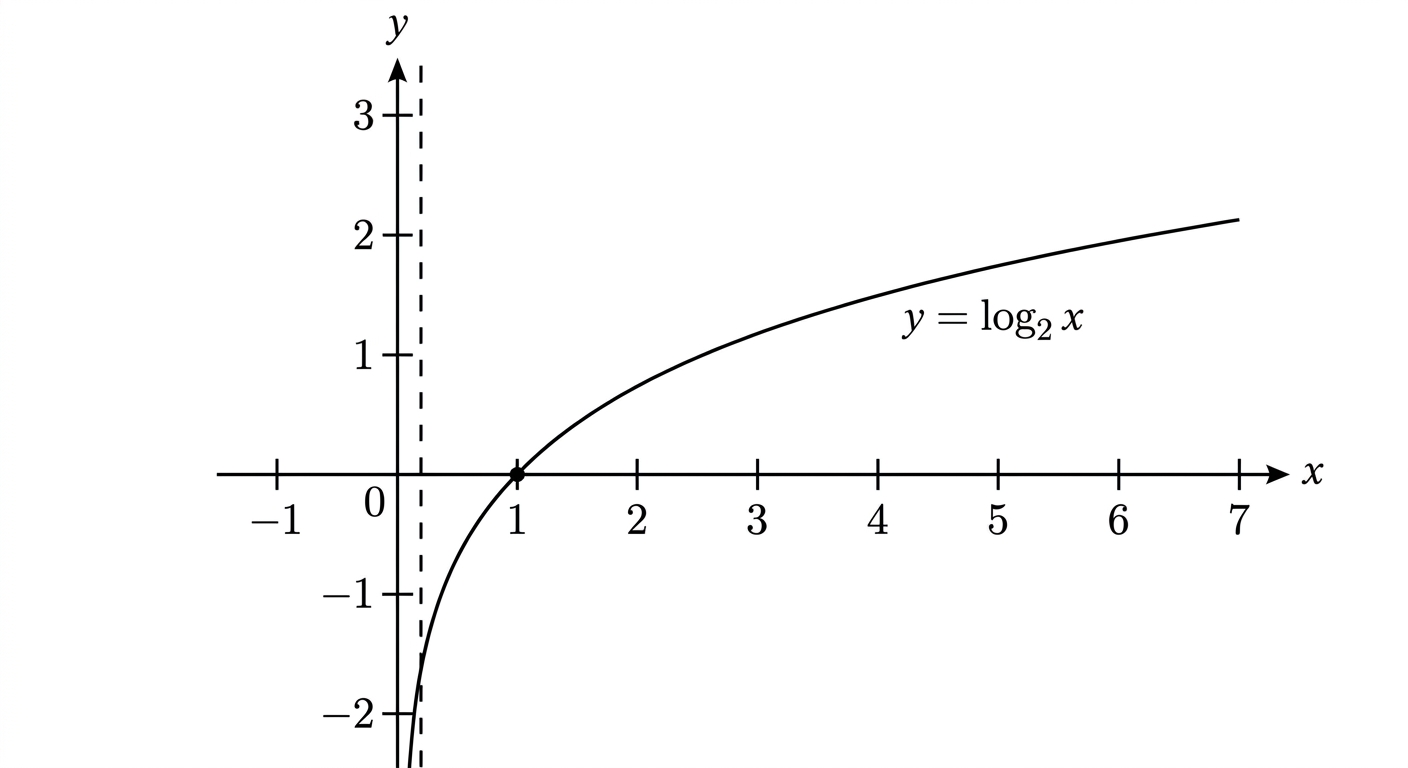
The diagram shows the graph of .
a
State the domain of . [1]
b
State the range of . [1]

Solutions
2QuestionComparing exponential and logarithmic graphsAssessment Practice
5 marks~8 minCriterion C
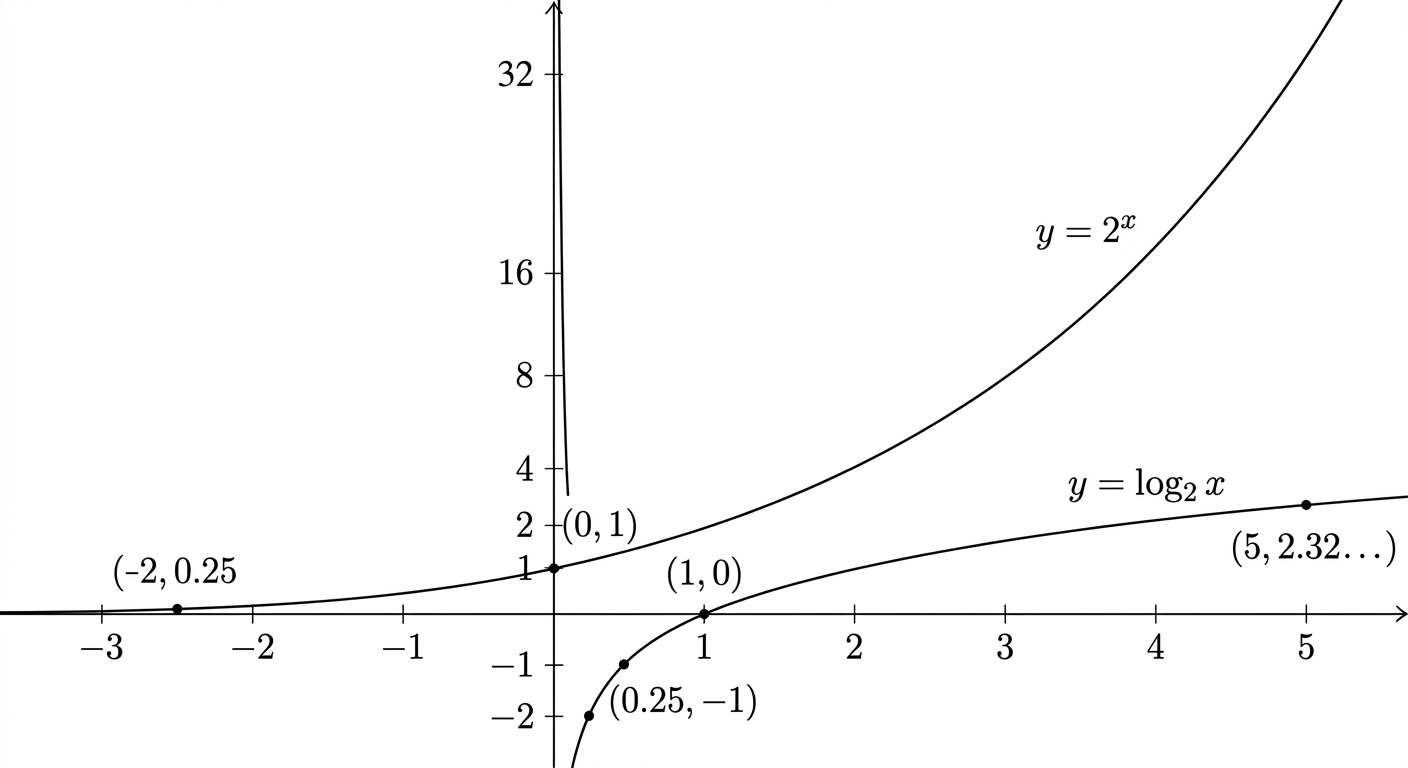
The diagram shows the graphs of and for .
a
Write down the equation of the asymptote of . [1]
b
Both and intersect the line . Deduce the geometric relationship between the graphs of and . [2]
c
A student claims that for all . Justify whether this claim is correct. [2]
Solutions
3QuestionComparing exponential and logarithmic graphsAssessment Practice
6 marks~9 minCriterion D
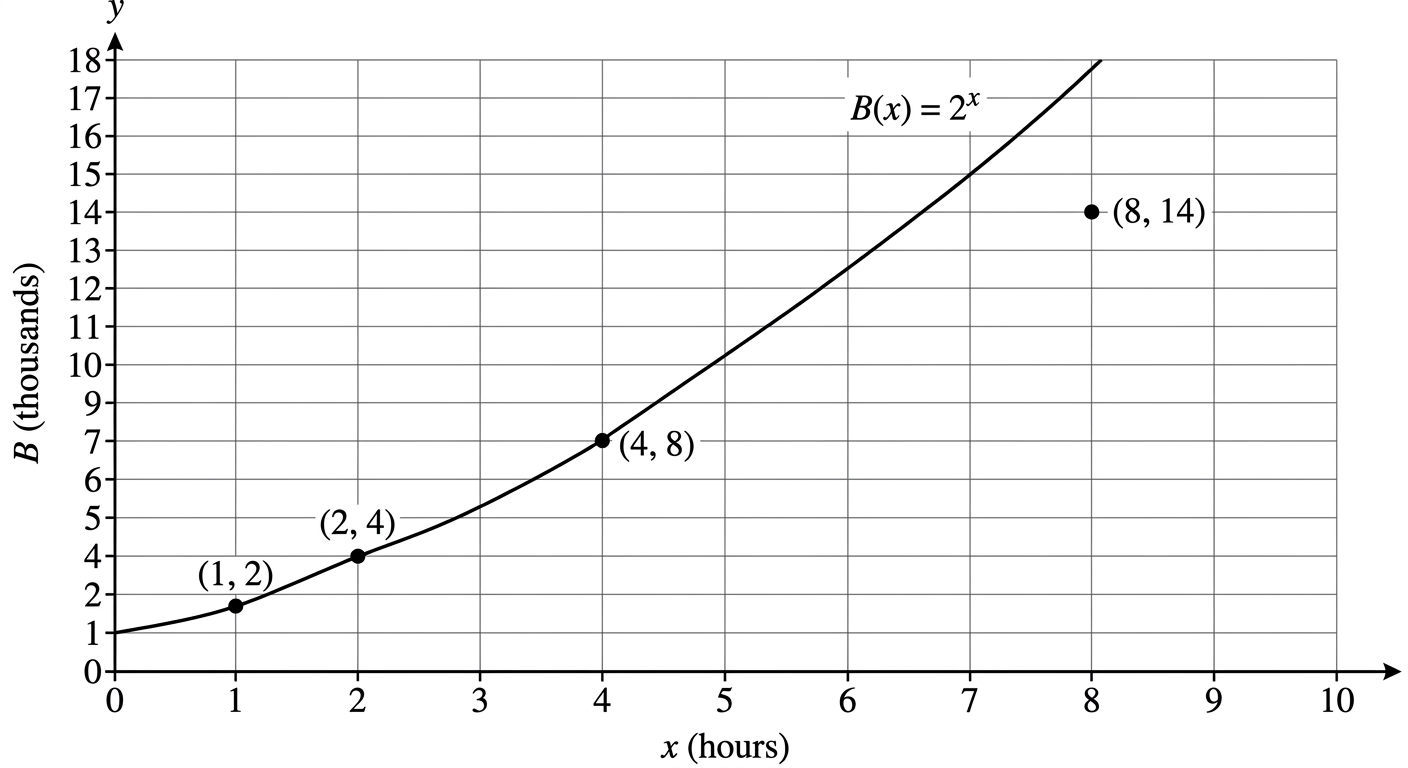
A biologist records the size of a bacterial colony at hourly intervals. The observed counts (in thousands of bacteria) are shown below.
The biologist proposes the exponential model , where is the population in thousands and is the time in hours. The diagram shows the curve and the four observed data points.
| (hours) | 1 | 2 | 4 | 8 |
|---|---|---|---|---|
| Observed (thousands) | 2 | 4 | 8 | 14 |
The biologist proposes the exponential model , where is the population in thousands and is the time in hours. The diagram shows the curve and the four observed data points.
a
Complete the table of predicted values using .
| (hours) | 1 | 2 | 4 | 8 |
|---|---|---|---|---|
| Predicted (thousands) | 2 | 4 | \_\_\_ | \_\_\_ [1] |
b
Calculate the percentage error between the predicted and observed values at and at , giving your answers to 1 decimal place.
[2]
[2]
c
Using your results from part (b), justify whether the biologist should continue using the exponential model to predict bacterial population beyond hours, and identify one biological reason why exponential growth cannot continue indefinitely. [3]
Solutions
4QuestionComparing exponential and logarithmic graphsAssessment Practice
8 marks~12 minCriterion B
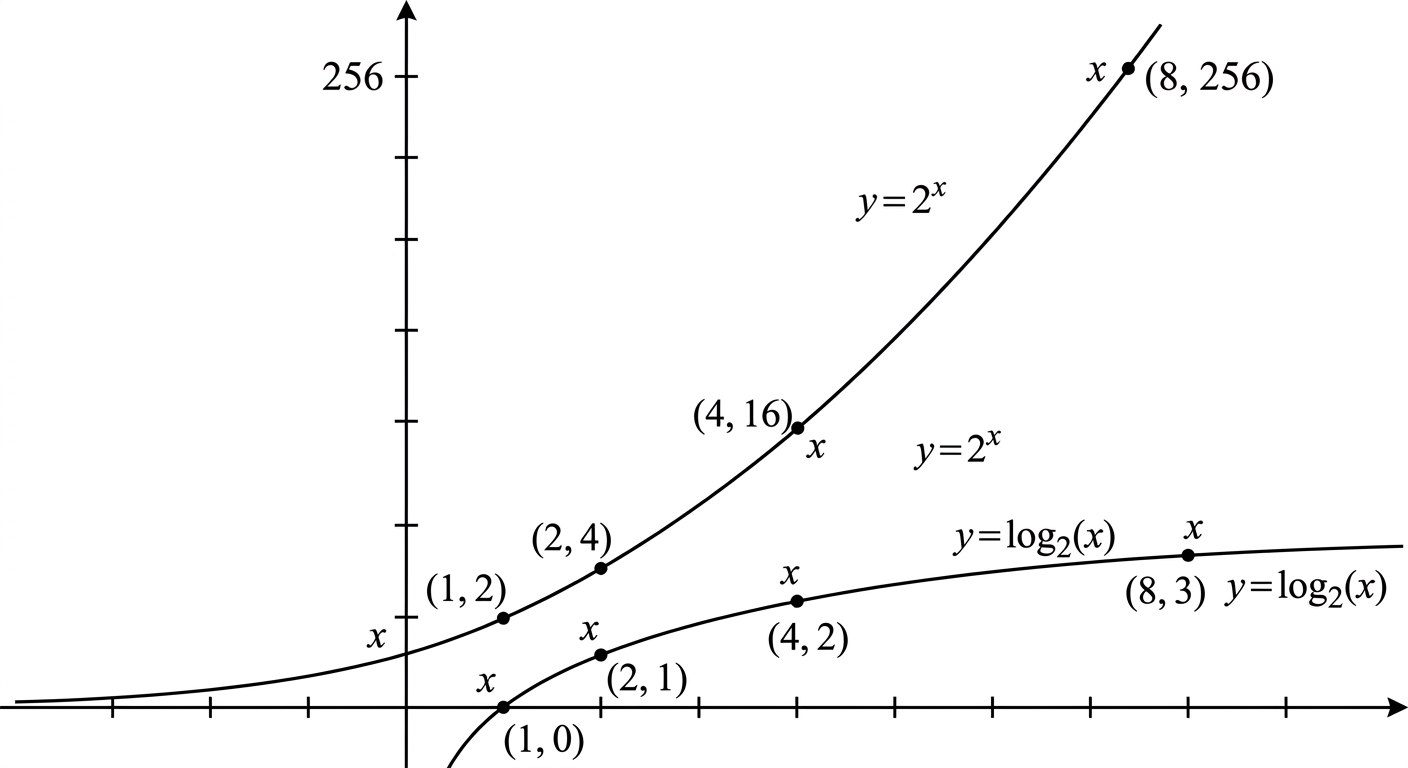
The diagram shows the graphs of and drawn on the same axes for .
The table below records selected values of both functions.
The table below records selected values of both functions.
| 1 | 2 | 4 | 8 | |
| 2 | 4 | 16 | 256 | |
| 0 | 1 | 2 | 3 |
a
Describe the pattern in the values of as doubles from 1 to 2, from 2 to 4, and from 4 to 8. Hence deduce the value of . [2]
b
A student claims that when doubles, the value of is squared. Using values from the table, verify this claim for two consecutive doublings of , and find the value of such that . [3]
c
The two graphs are reflections of each other in the line . Using the identity and a pair of corresponding table values, justify whether and are inverse functions, and state the domain and range of . [3]
Solutions
That's every free question here — 4 of 147.
+143 more questions, plus Mock Papers & Worksheets, are waiting in Premium.