You're viewing free preview questions — 4 questions previewing here — subscribe to unlock 70 more, plus the Full Question Bank, Mock Papers & Worksheets.Upgrade
Box Plots, Histograms and Cumulative Frequency 1 — Free MYP5 Mathematics (Extended) Practice Questions

1QuestionCumulative Frequency Graphs and CurvesAssessment Practice
2 marks~3 minCriterion D
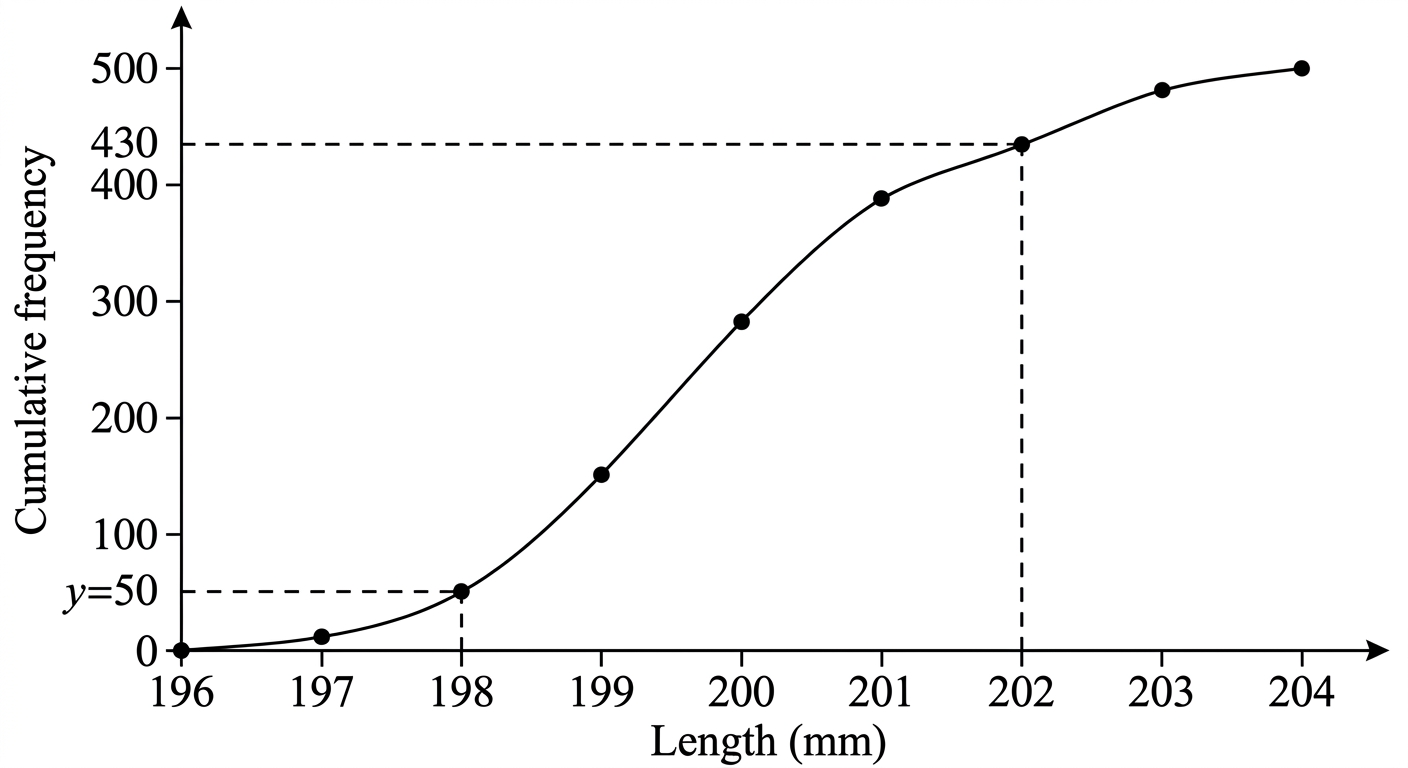
A factory produces steel rods with a target length of 200 mm. A cumulative frequency graph is drawn from a sample of 500 rods. The graph passes through the points (198, 50) and (202, 430).
a
Deduce the number of rods outside the acceptable tolerance range of 198–202 mm. [1]
b
Advise the factory manager whether the production process requires corrective action, justifying your answer using the result from part (a). [1]

Solutions
2QuestionConstructing and Interpreting Box PlotsAssessment Practice
4 marks~6 minCriterion C
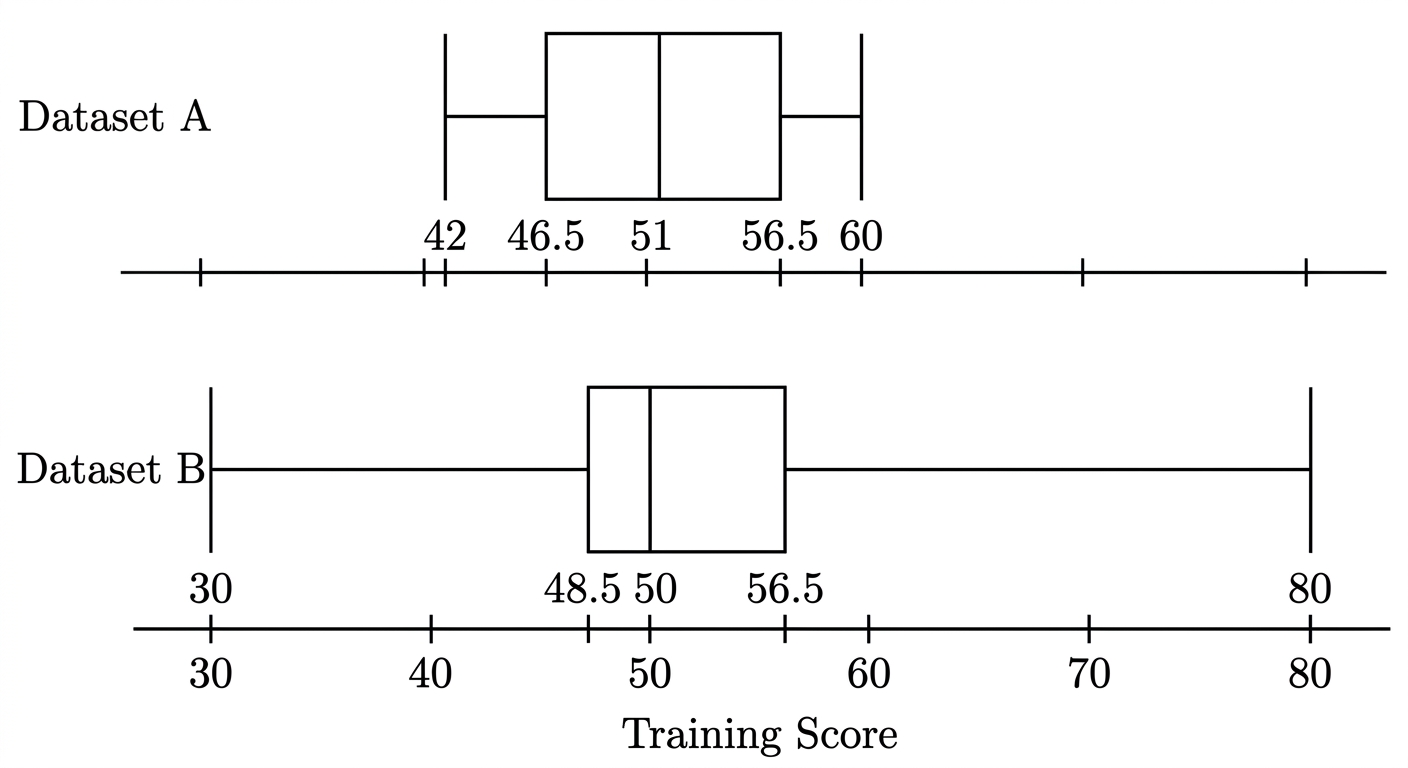
A sports analyst is comparing the consistency of two athletes' training scores. She notes that larger sample sizes may produce more stable quartiles. She examines two datasets of daily training scores.
Dataset A (8 values): 42, 45, 48, 50, 52, 55, 58, 60
Dataset B (20 values): 30, 35, 40, 45, 48, 49, 50, 50, 50, 50, 50, 51, 52, 53, 55, 58, 62, 68, 72, 80
Dataset A (8 values): 42, 45, 48, 50, 52, 55, 58, 60
Dataset B (20 values): 30, 35, 40, 45, 48, 49, 50, 50, 50, 50, 50, 51, 52, 53, 55, 58, 62, 68, 72, 80
a
Calculate the five-number summary and IQR for each dataset. [2]
b
Construct box plots for both datasets on the same scale from 30 to 80. [1]
c
The analyst concludes that Dataset B's scores are more consistent because its IQR is smaller. Critique her conclusion, referring to both the IQR and the range of each dataset. [1]
Solutions
3QuestionCumulative Frequency Graphs and CurvesAssessment Practice
5 marks~8 minCriterion A
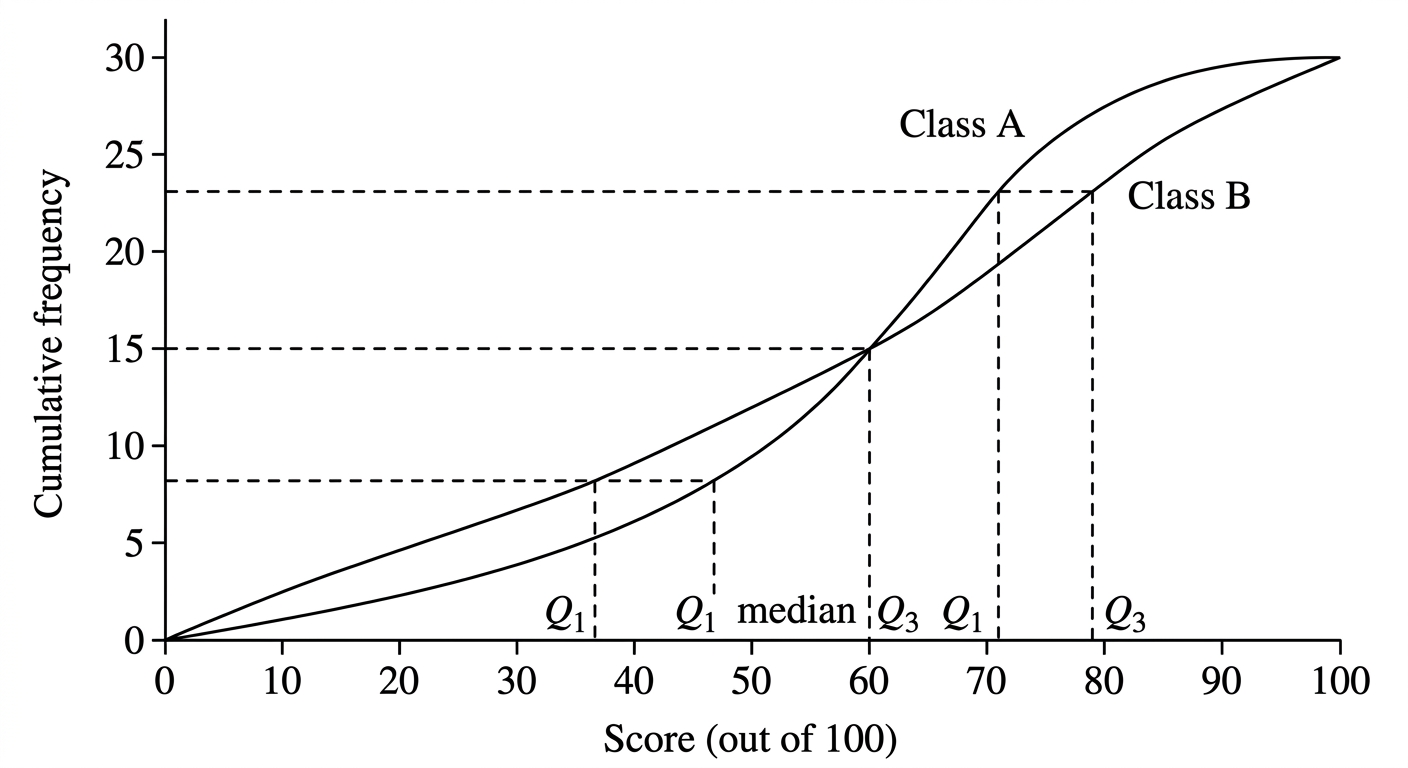
Two cumulative frequency graphs display test scores (out of 100) for 30 students in each of Class A and Class B.
Class A: median , lower quartile , upper quartile . The curve rises steeply between scores of 50 and 80.
Class B: median , lower quartile , upper quartile . The curve rises more gradually across the full range.
Class A: median , lower quartile , upper quartile . The curve rises steeply between scores of 50 and 80.
Class B: median , lower quartile , upper quartile . The curve rises more gradually across the full range.
a
State the interquartile range (IQR) for each class. [2]
b
Justify which class performed better overall and which class was more consistent, referring to the median, IQR, and the shape of the cumulative frequency curves. [3]
Solutions
4QuestionConstructing and Interpreting Box PlotsAssessment Practice
6 marks~9 minCriterion B
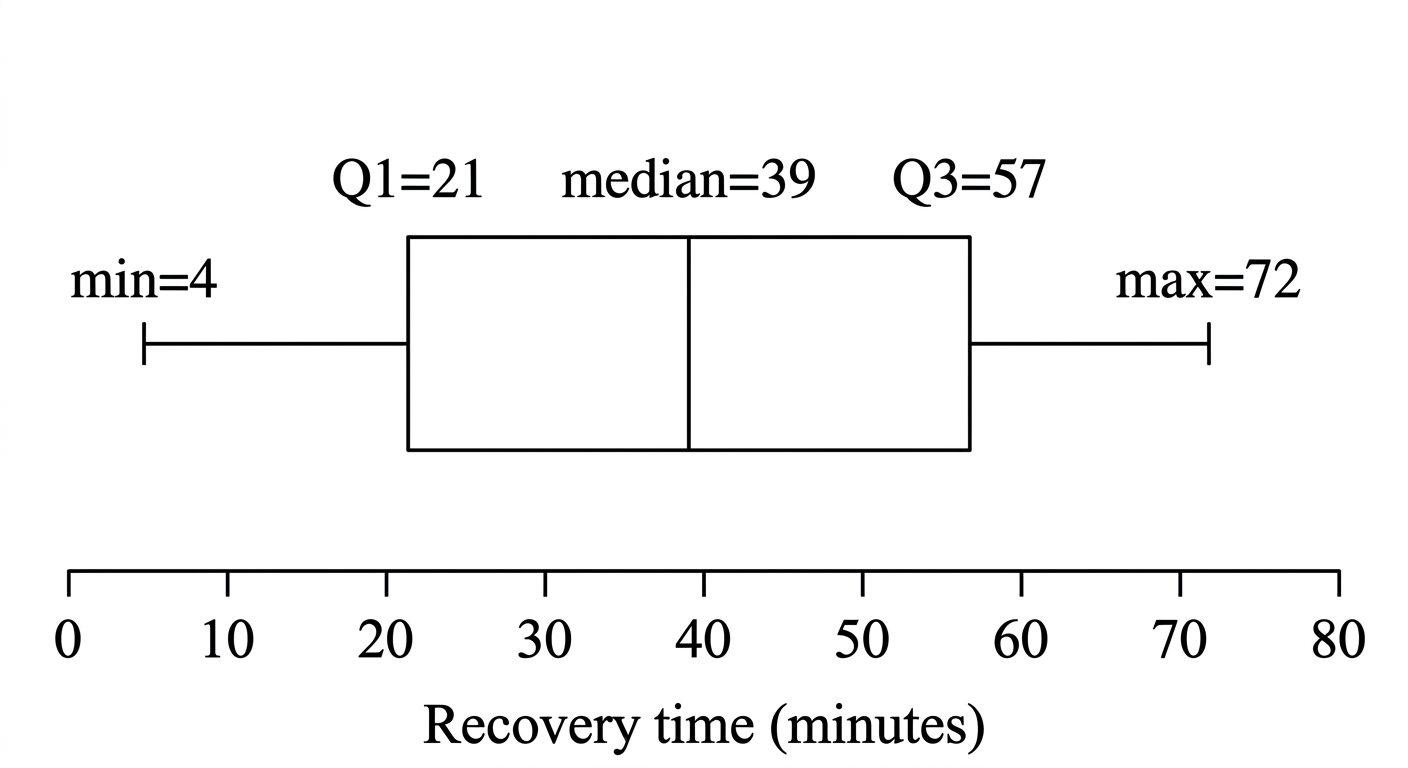
A sports analyst records the recovery times (in minutes) of 23 athletes after a training session. The ordered values are:
Quartile positions for datasets of size are given below.
: at position 2, median at position 4, at position 6
: at position 3, median at position 6, at position 9
: at position 4, median at position 8, at position 12
: at position 5, median at position 10, at position 15
Quartile positions for datasets of size are given below.
: at position 2, median at position 4, at position 6
: at position 3, median at position 6, at position 9
: at position 4, median at position 8, at position 12
: at position 5, median at position 10, at position 15
a
Deduce a general rule, in terms of , for the positions of the median, , and in an ordered dataset of values. [2]
b
Using your rules from part (a), construct the five-number summary for the 23 recovery times, showing all position calculations. [2]
c
The analyst claims that the middle 50% of athletes recover within a 36-minute window. Justify whether the interquartile range supports this claim. [2]
Solutions
That's every free question here — 4 of 74.
+70 more questions, plus Mock Papers & Worksheets, are waiting in Premium.