You're viewing free preview questions — 4 questions previewing here — subscribe to unlock 115 more, plus the Full Question Bank, Mock Papers & Worksheets.Upgrade
Box Plots, Histograms and Cumulative Frequency 2 — Free MYP5 Mathematics (Extended) Practice Questions

1QuestionBox plots and quartilesAssessment Practice
6 marks~9 minCriterion C
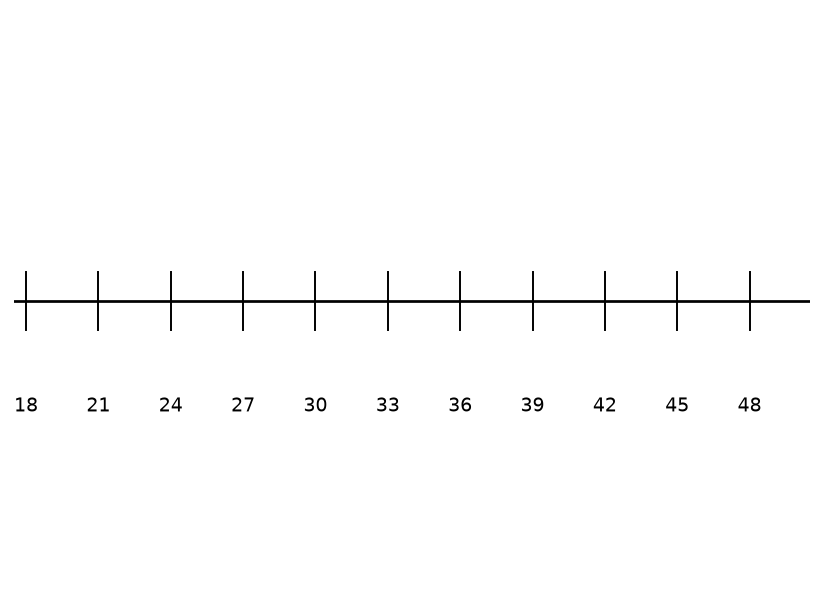
The following 11 test scores are listed in ascending order.
a
State the median and interquartile range (IQR) of this data set. [2]
b
A twelfth score, , is added to the data set. The new median is 34. Find the value of . [2]
c
A student claims that adding to the data set does not change the IQR. Justify whether this claim is correct. [2]

Solutions
2QuestionBox plots and quartilesAssessment Practice
6 marks~9 minCriterion D
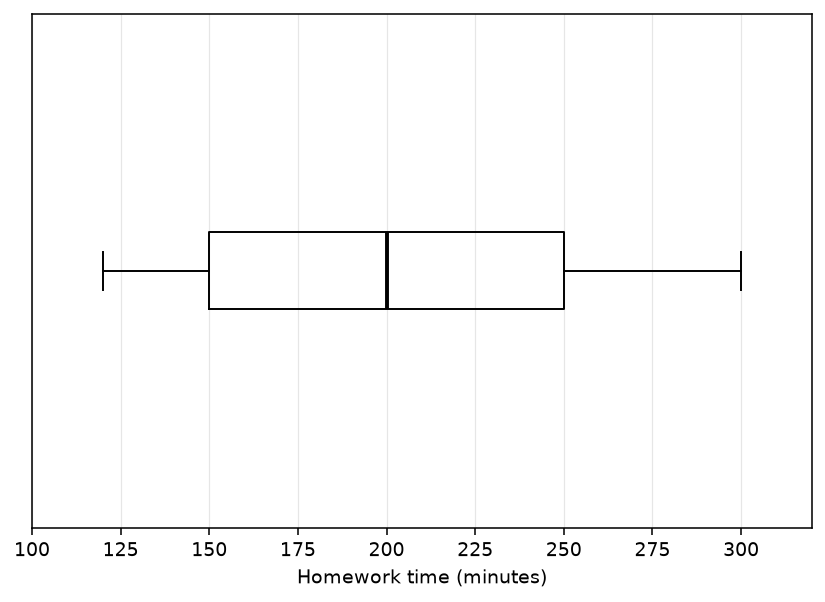
A school surveys a random sample of 7 students and records the number of minutes each student spends on homework in one week. The results are:
The school wishes to use a box plot of this sample to draw conclusions about all 200 students in the year group.
The school wishes to use a box plot of this sample to draw conclusions about all 200 students in the year group.
a
State the median and interquartile range (IQR) of this data set. [2]
b
A new student joins the sample. The mean of all 8 values is 196.25 minutes. Find the number of minutes this student spent on homework. Give your answer as an exact value. [2]
c
The school claims the box plot of the original 7 students reliably represents the homework habits of all 200 students. Assess whether this claim is reasonable, referring to both the sample size and one other statistical consideration. [2]
Solutions
3QuestionBox plots and quartilesAssessment Practice
9 marks~14 minCriterion A
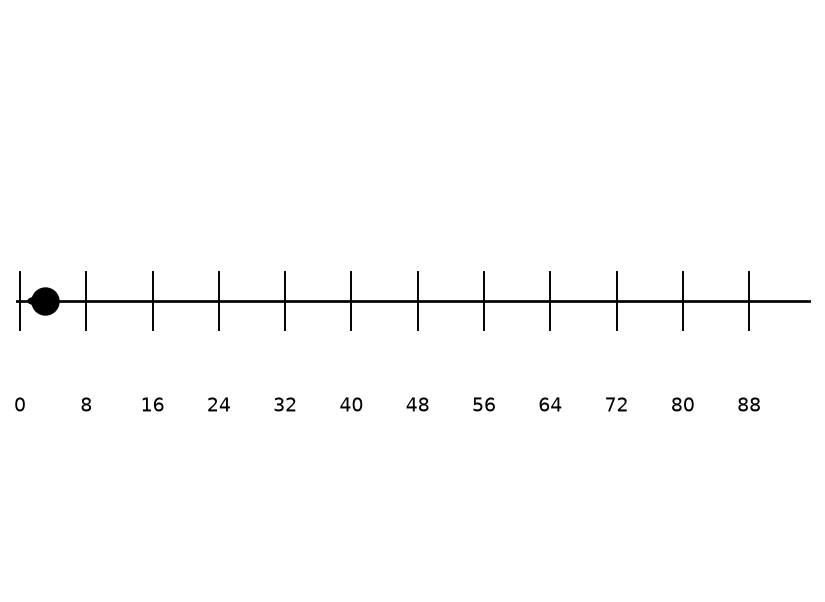
The ordered test scores (out of 100) of 15 students are shown below.
a
Find the median, lower quartile , and upper quartile of the data. [3]
b
A value is defined as an outlier if it lies below or above , where .
Show that 3 is the only outlier in this dataset. [3]
Show that 3 is the only outlier in this dataset. [3]
c
A second class of 15 students sits the same test. Their scores have the same median and the same interquartile range as the first class, but a larger standard deviation.
Justify whether the second class's results should be considered more or less consistent than the first class's results, referring to both measures in your answer. [3]
Justify whether the second class's results should be considered more or less consistent than the first class's results, referring to both measures in your answer. [3]
Solutions
4QuestionBox plots and quartilesAssessment Practice
10 marks~15 minCriterion B
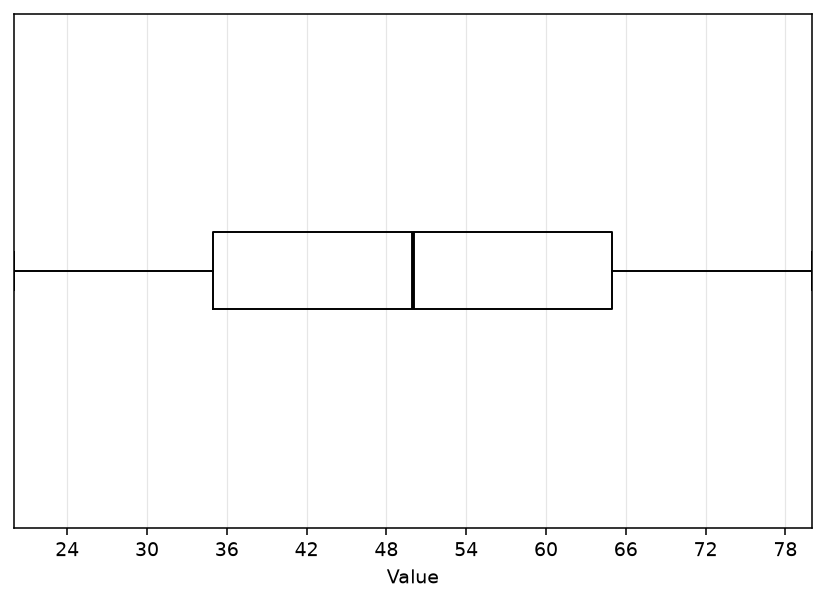
The table below shows five datasets of increasing sample size. All datasets share the same minimum (20), maximum (80), and median (50), but have different interquartile ranges.
| Dataset A | |||
|---|---|---|---|
| Dataset B | |||
| Dataset C | |||
| Dataset D | |||
| Dataset E |
a
Calculate the interquartile range for each dataset and describe how the IQR changes as increases, including the size of each successive decrease. [3]
b
A sixth dataset has and follows the same pattern. Deduce the IQR for this dataset and write down a general rule for the IQR in terms of , valid for . [3]
c
Justify why the linear rule found in part (b) must eventually break down, referring to the positions of and relative to the fixed median and the constraints imposed by the minimum and maximum. [4]
Solutions
That's every free question here — 4 of 119.
+115 more questions, plus Mock Papers & Worksheets, are waiting in Premium.